
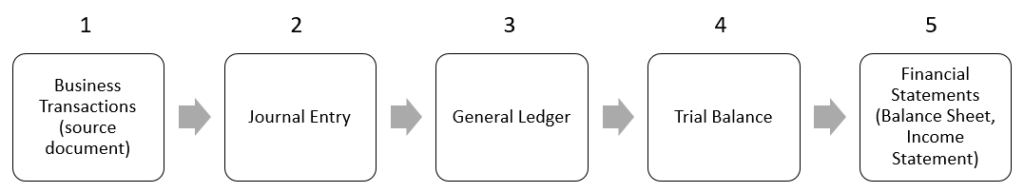
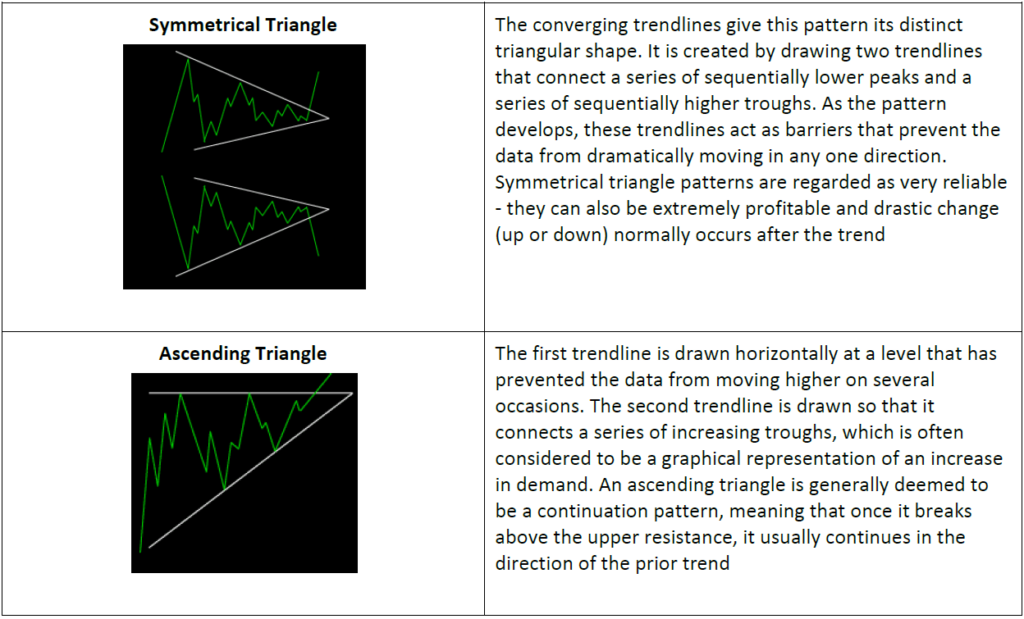
The accounting cycle is explained by means of a diagram.
THE ACCOUNTING CYCLE
The accounting cycle is a series of steps in recording an accounting event from the time a transaction occurs to its reflection in the financial statements (also called the bookkeeping cycle).
The steps in the accounting cycle are:
- Recording in journal
- Posting to the ledger
- Preparing a trial balance
- Preparing financial statements.
This procedure is further described as:
Analyse transactions – The accounting process begins with analysing transactions. The company first looks at the source documents which describe the transactions and events. Source documents can be either hard copy or electronic. Some examples of source documents include bank statements, cheques, and purchase orders.
Journalise/ enter transactions in the journal – When the company journalises, the accountant applies the rules of double-entry accounting. Double-entry accounting means that each transaction must be recorded in at least two accounts, or that the debits must equal the credits. After applying the rules of debits and credits, the accountant should then record the transactions in a journal, or journalise. A journal is a complete record of each transaction.
Post to ledger accounts – Posting involves transferring information from the journal to the ledger. A ledger is simply a collection of all accounts – it shows all of the number detail about a company’s accounts.
Prepare a Trial balance – To verify that the company’s debits equal the credits, an unadjusted trial balance is prepared. A trial balance is a list of all accounts and their balances at a point in time. The information used in a trial balance comes from the ledger. The account balances from the ledger are used to create the trial balance. We call this trial balance an unadjusted trial balance because it is prepared before the adjusting entries.
Make adjusting entries – Adjusting entries involve bringing an asset or liability account balance to its proper amount and updating the corresponding revenue or expense account. Adjusting entries are recorded in the general journal and then posted to the ledger. All adjusting entries are made at the end of the accounting time period.
Prepare Adjusted Trial balance – This trial balance is called the adjusted trial balance because it is prepared AFTER the adjusting entries. This trial balance is used to verify that the debits equal the credits and also is used to prepare the financial statements.
Prepare financial statements – The financial statements must be prepared in a very specific order. The order for the financial statements is: Statement of Comprehensive Income (income statement), statement of retained earnings, Statement of Financial Position (balance sheet), and then statement of cash flows. This order is important because information provided in the Statement of Comprehensive Income (income statement) is used in the statement of retained earnings, and information from the statement of retained earnings is used in the Statement of Financial Position (balance sheet).
Journalise and post-closing entries – Closing entries are prepared after the financial statements are completed. The purpose of closing entries is to prepare the accounts for recording transactions and events for the next period.
Prepare an after closing Trial balance – For many companies this is the last step in the accounting cycle, as the company is now ready to start the new accounting period. A post-closing trial balance should only contain the debit and credit balance for permanent accounts, because these are the only accounts that are remaining after the closing process. Once again the purpose of this trial balance is to ensure that the debits equal the credits and that all temporary accounts have a zero balance.
Reversing entries are optional. These entries reverse certain adjustments in the next period.

The main steps of the accounting cycle can be represented by the following graphic (reduced to 5 main steps):
International financial reporting standards – IFRS vs. GAAP
Many people and organisations make decisions based on financial information that accountants prepare. That’s why it is important for these people to understand how this information is measured. To facilitate this communication, accountants establish rules that business people can use to ensure they are talking about the same thing.
All the rules of accounting and accounting measurement are collected in one group called International Financial Reporting Standards (IFRS) (Note: South Africa used to use Generally Accepted Accounting Principles (GAAP) and are subject to certain statutory regulations.
As a basis for financial analysis, we need to understand some basics first, such as:
- Statutory regulations
- IFRS
STATUTORY REGULATIONS
Accounting records
In terms of the Companies Act, 2008, all companies must keep accounting records in one of the eleven official languages. At a minimum, these records must include:
- The assets and liabilities of the company
- A fixed-assets register
- Cash receipts and payments
- Details of goods purchased and sold
- Annual stock-taking (inventory) statements
The accounting records must be such as to fairly present the state of affairs and business of the company and explain the transactions and financial position of the trade or business of the company.
Annual financial statements
The Companies Act, 2008 aims to provide a flexible regime that balances accountability and transparency, with less
of a regulatory burden. To that end, it sets certain common requirements for all companies. Differentiated
requirements depend on the company’s wider responsibility to the public and the social and economic impact that
the company’s operations have. This flexibility is illustrated by the following provisions:
- All companies must prepare annual financial statements (AFSs), unless the company can satisfy the
Commission that it meets certain criteria - Public companies are subjected to a more demanding regime, with the added requirement that their AFSs
have to undergo an annual audit - All companies have to file annual returns with the Commission
- Public companies have to file a copy of their audited AFSs with their annual return
- Public companies must appoint a company secretary, auditors and an audit committee.
- Certain private companies with a greater responsibility to the wider public as a consequence of their
significant social or economic impact may be required to have their AFSs audited. All other companies must
be either voluntarily audited or independently reviewed - All financial statements, or a summary thereof, must satisfy the prescribed financial reporting standards.
These standards may vary for different categories of companies but must be consistent with International
Financial Reporting Standards as set by the International Accounting Standards Board - All public and certain private companies must appoint an auditor
Thus the law (which is part of an organisation’s business environment) requires that an organisation’s annual
financial statements shall be set out in accordance with certain financial reporting frameworks.
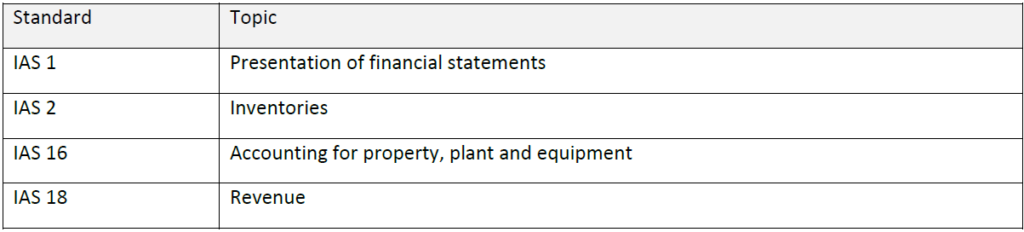
This manual will refer to the appropriate IFRS standards in the terminology that it is published. Thus standards will
be referred to as IAS x. IAS stands for International Accounting Standard and the ‘x’ denotes the number of the
standard for example “IAS 2”.
The framework deals with:
- The objective of financial statements which is to:
– To provide financial information about the:
– Financial position
– Performance
– Changes in financial position
of an organisation that is useful to a wide range of users for making economic decisions, such as investors,
employees, lenders of finance, suppliers of trade credit, customer, government and the general public. - The qualitative characteristics that determine the usefulness of information in financial statements
- The elements from which financial statements are constructed
- The concepts of capital and maintenance
It is important to note that financial statements, even though they may comply with the framework, should be treated
with care for the following reasons:
– They do not necessarily supply all the financial information required
– They are historically based
– They do not necessarily provide non-financial information
To expand your knowledge, it is suggested that you acquire and read guidelines to IFRS in South Africa. These
guidelines should be available from:
– Your organisation (probably through your finance department)
– Your organisation’s auditors
– A supplier or publisher of financial publications
IFRS standards
Some of the IFRS standards referred to in this manual include:
Presentation of financial statements
IAS 1 sets out how financial statements should be presented. Organisations that follow these practices will be able to
compare their own financial statements with:
– Their own organisation’s previous financial statements
– Financial statements of other organisations that follow these practices
Financial statements should ‘fairly present’ the financial position of an organisation. An organisations financial statements that adhere to IAS, disclose relevant interpretations and provide additional disclosures when necessary, are presumed to be fairly presented and should contain a note to this effect.
IAS 1 defines a complete set of financial statements as comprising of the following:
Let’s examine the Statement of Financial Position (balance sheet) as an example of a financial statement:
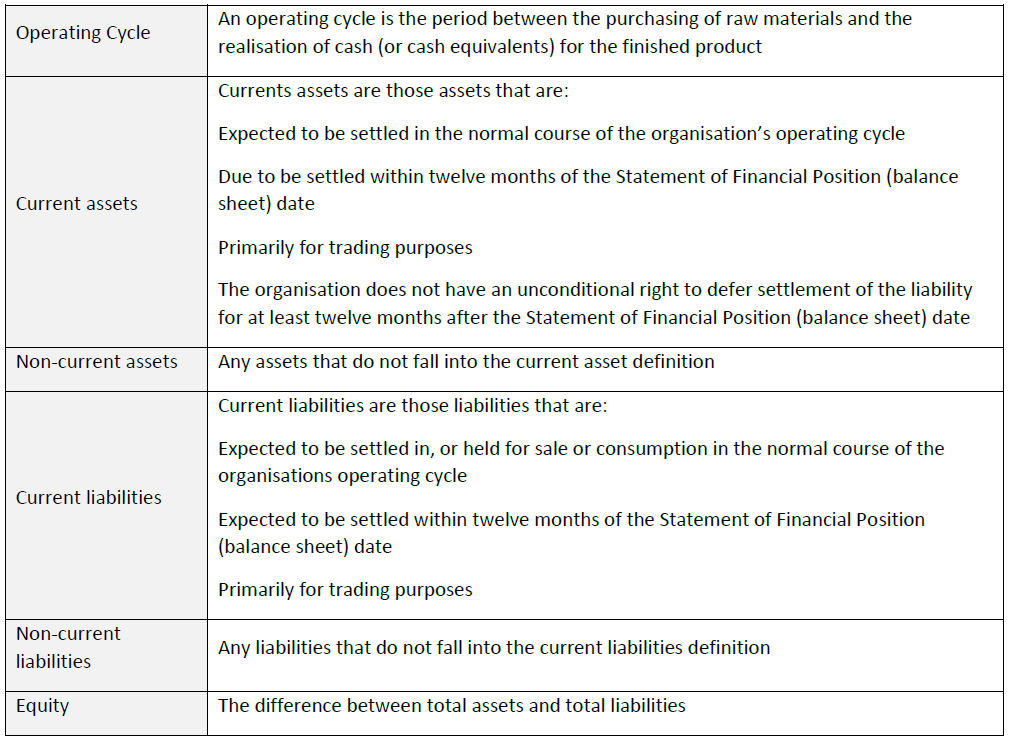
The Statement of financial position (balance sheet) comprises two main sections:
- Assets (The properties used in the operation or investment activities of a business)
- Liabilities (Claims by creditors to the property /assets of a business until they are paid) and Equity (The owner’s rights to the property (assets) of the business; also called proprietorship and net worth)
An organisation is required to present current and non-current assets and current and non-current liabilities separately unless a liquidity approach allows for a fairer presentation. The liquidity approach presents assets and liabilities in order of liquidity and is generally adopted by organisations that do not have a clearly identifiable operating cycle, for example financial institutions.
Note: IAS 1 is a comprehensive statement and the full implications of IAS 1 are not dealt with here. Only the aspects
that are relevant to later topics in this manual have been covered.
Inventories
IAS 2 relates to accounting for inventories (or stock).
Inventories are defined by IAS 2 as assets:
Held for sale in the ordinary course of business
In the process of production for sale
In the form of materials or supplies to be consumed in the production process or in the rendering of services
As such, inventories include:
Finished goods for sale
Work-in- progress
Raw materials
Consumables (as specified in the third point above)
Merchandise
Products and services
Accounting for inventories
The main concern in accounting for inventories is the cost to be recognised as an asset. Inventory is recognised as an
asset when:
It is controlled by the organisation
It is the result of a past event (purchase or production)
There are probable future benefits to be derived from the asset
There is a cost that can be reliably measured and attached
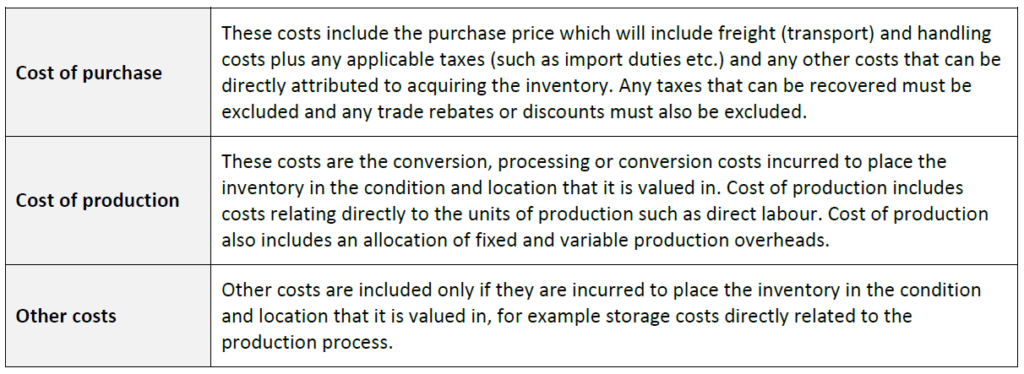
Costing inventories
Inventories are generally valued at historical cost. This is the total cost of purchase and production and other costs
that were incurred to place the inventory in the condition and location that it is valued in.
Specific exclusions
IAS 2 excludes the following from the cost of inventories:
Selling expenses
General administration overheads
Storage costs of finished goods
Abnormal waste incurred in the production process which does not relate to placing the inventory in the
condition and location that it is valued in
Net realisable value
Inventory should be measured at the lower of:
Cost
Net realisable value
One of the conditions (noted earlier) for inventory to be recognised as an asset is that there are probable future
benefits to be derived from the asset. If the future economic benefit of the inventory is less than the cost of the
inventory, then the value of the inventory should be diminished to reflect the anticipated future revenues. In other
words, inventory should be written down to net realisable value. These write downs may be reversed if circumstances
change.
IAS 2 defines net realisable value as the estimated selling price in the ordinary course of business less the estimated
costs of completion and the estimated costs to make the sale.
Note: IAS 2 is a comprehensive statement and the full implications of IAS 2 are not dealt with here. Only the aspects
that are relevant to later topics in this manual have been covered.
Property, plant and equipment
Property, plant and equipment are defined as tangible assets that:
Are used in the production or supply of goods and services, for rental to others or for administrative
purposes
Are expected to be used for more than one accounting period
IAS 16 relates to accounting for property, plant and equipment and deals with two major issues in accounting for
property, plant and equipment:
Timing– the timing of recognition of property, plant and equipment
Charges – determining carrying charges and related depreciation charges
Recognition of property, plant and equipment
Property, plant and equipment should be recognised as assets when:
It is probable that future economic benefits associated with the item will flow to the organisation
The cost of the item can be measured reliably
Charges for property, plant and equipment
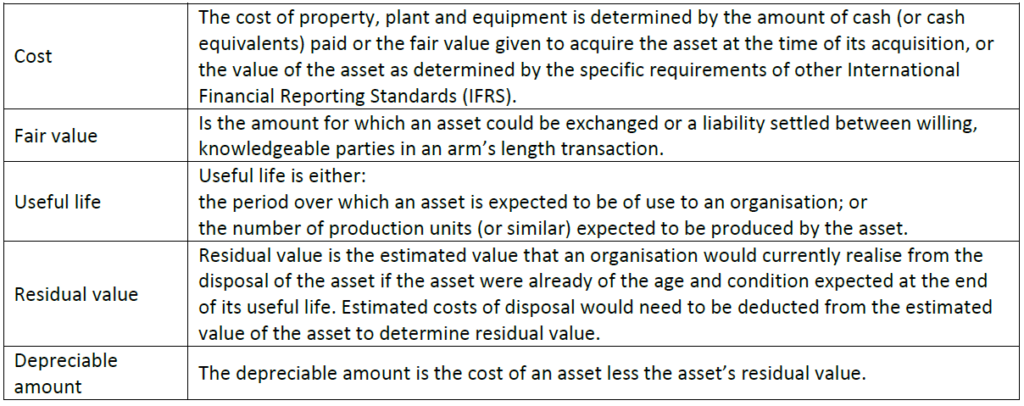
Depreciation
This is the allocation of the depreciable amount of an asset over its useful life. Property, plant and equipment should
initially be measured at cost.

The cost of property, plant and equipment includes:
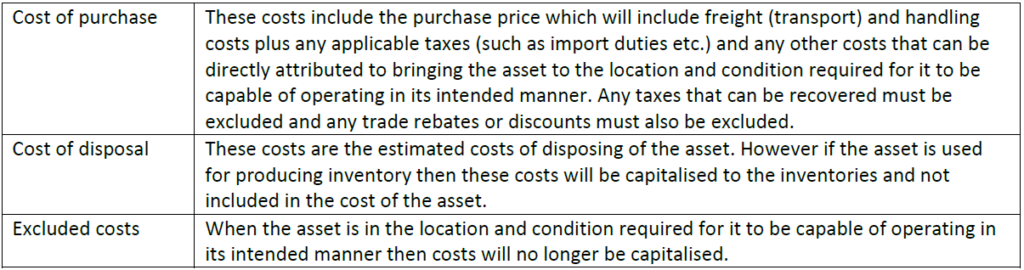
IAS 16 highlights the three most common methods of depreciation:
Straight-line
Diminishing balance
Sum-of-the-units
Note: IAS 16 is a comprehensive statement and the full implications of IAS 16 are not dealt with here. Only the aspects
that are relevant to later topics in this manual have been covered.
Revenue
IAS 18 relates to accounting for revenue (or sales, turnover, fees, etc). Revenue is the income stream generated during
the course of the ordinary activities of an organisation.
Revenue should be accounted for at fair value which is the amount for which an asset could be exchanged or
a liability settled between willing, knowledgeable parties in an arm’s length transaction. Furthermore:
Revenue should be net of trade discounts and rebates
When a transaction is financed ‘interest free’ the fair value is calculated by discounting all future cash receipts using
an imputed rate of interest. The difference between the fair value of the transaction and the discounted value of all
the future cash receipts is recognised as interest revenue.
When the revenue generated by a transaction includes an amount for subsequent maintenance or servicing (not
warranties) then the amount that is identified for maintenance or servicing should be deferred and only recognised,
on an appropriate basis, as revenue over the period which the maintenance or servicing takes place.
Interest, royalties and dividends
Revenue resulting from interest, royalties and dividends should be recognised when:
The amount of the revenue can be measured reliably
It is probable that the economic benefits of the transaction will flow to the organisation
Reproduced by The Governance Institute under Government Printer’s Copyright
Authority No. 11214 dated 15 July 2004
IAS 18 requires the following disclosure:
The accounting policies adopted for the recognition of revenue, including the methods adopted to
determine the stage of completion of transactions involving the rendering of services
The amount of each significant category of revenue recognised during the period. These categories include:
The sale of goods
The rendering of services
Interest
Royalties
Dividends
The amount of revenue arising from the exchanges of goods or services, analysed by category
Note: IAS 18 is a comprehensive statement and the full implications of IAS 18 are not dealt with here. Only the aspects
that are relevant to later topics in this manual have been covered.
Note: IAS 17 deals with the recognition of income from leases and IAS 28 deals with profits from associates. These are
beyond the scope of this manual.
Using IFRS in financial analysis
The statutory requirements and the IFRS requirements must be considered while doing financial analysis and working
through this learner guide. Remember that for internal reporting and analysis purposes an organisation has to abide
by IFRS. However, the organisation must be consistent in its treatment of financial recording and analysis if the
recording and analysis is to be of value to the organisation. It is therefore recommended that organisations adopt IFRS
for internal use where possible.
IFRS includes numerous guidelines and conventions that help insure that reported financial information is accurate,
objective and reasonably consistent for all types of business, so that results from one business can be compared to
those from another.
Although accountants apply International Financial Reporting Standards, there is room for variation among different
businesses (and among different accountants) in the application of IFRS.
Consistency generally is required within a particular business. However, different policies in different businesses can
affect their reported results and distort the picture of where your business stands in relation to other businesses.
In this regard, consider that:
The time at which sales show up on an Statement of Comprehensive Income (income statement) may differ
from business to business. A more aggressive approach may accelerate income items by reporting them at
the earliest possible moment, while a more conservative approach may postpone revenues.
Depreciation charges for financial reporting purposes on essentially similar assets can differ from business to
business, depending on accounting policies with regard to depreciation methods and useful lives
Inventory accounting policies may differ. A business using first-in, first-out (FIFO) accounting will show higher
profits in a period of rising prices than will a business using last-in, first-out (LIFO) accounting. Note that LIFO
is not in terms of IFRS.
Policies may differ in regard to expensing. One business may charge an item to income immediately as an
expense, while another business may capitalise the same item and report a higher profit.
Different methods of treating the cost of developing a product will affect the cost of goods sold and affect
the gross profit reported
Extraordinary or nonrecurring charges may or may not be reflected in operating income, depending on your
accounting policies
The treatment of tax items may vary from one business to the next
For all these reasons, when you’re comparing your financial statements to industry standards or to those of another
business, take the results with a grain of salt.
Calculating ratios according to IFRS
IFRS includes numerous guidelines and conventions that help insure that reported financial information is accurate,
objective and reasonably consistent for all types of business, so that results from one business can be compared to
those from another.
Although accountants apply International Financial Reporting Standards, there is room for variation among different
businesses (and among different accountants) in the application of IFRS
Consistency generally is required within a particular business. However, different policies in different businesses can
affect their reported results and distort the picture of where your business stands in relation to other businesses.
IFRS Standards that are useful and important in using ratios to analyse financial statements include:
IAS 1 – Presentation of financial statements
IAS 2 – Inventories
IAS 16 – Accounting for property, plant and equipment
IAS 18 – Revenue, to define sales (revenue)
There are other IAS statements that impact on defining and valuing assets but these are beyond the scope of this
learner guide.
Financial relationships
The relationship between the financial statements:
The financial statements of a company are developed from the bookkeeping process of the business. As the
company records the financial transactions of the firm over an accounting time period, the financial statements
begin to appear. They are developed through recording the transactions in the accounting journal and the general
ledger. The financial statements come together from those records. The financial statements are based on the
accounting equation.
The Statement of comprehensive income (income statement) and the accounting equation
The statement of comprehensive income (income statement) (statement of profit and loss) shows how profitable
the firm is. A positive net income means the firm is making money. A negative net income means the firm is losing
money. The statement of comprehensive income (income statement) is developed from the accounting entries for
revenues and expenses over the accounting period.
The accounting equation is stated as:
Assets = Liabilities + Owner’s Equity
In the accounting equation, owner’s equity is made up of revenue and expenses. Revenue increases owner’s equity
and expenses decrease owner’s equity (the money the owners have invested in the company). Since the firm’s
Statement of Financial Position (balance sheet) is based on the accounting equation, with owner’s equity a
component of the left side of the Statement of Financial Position (balance sheet), this is the tie to the Statement of
Comprehensive Income (income statement).
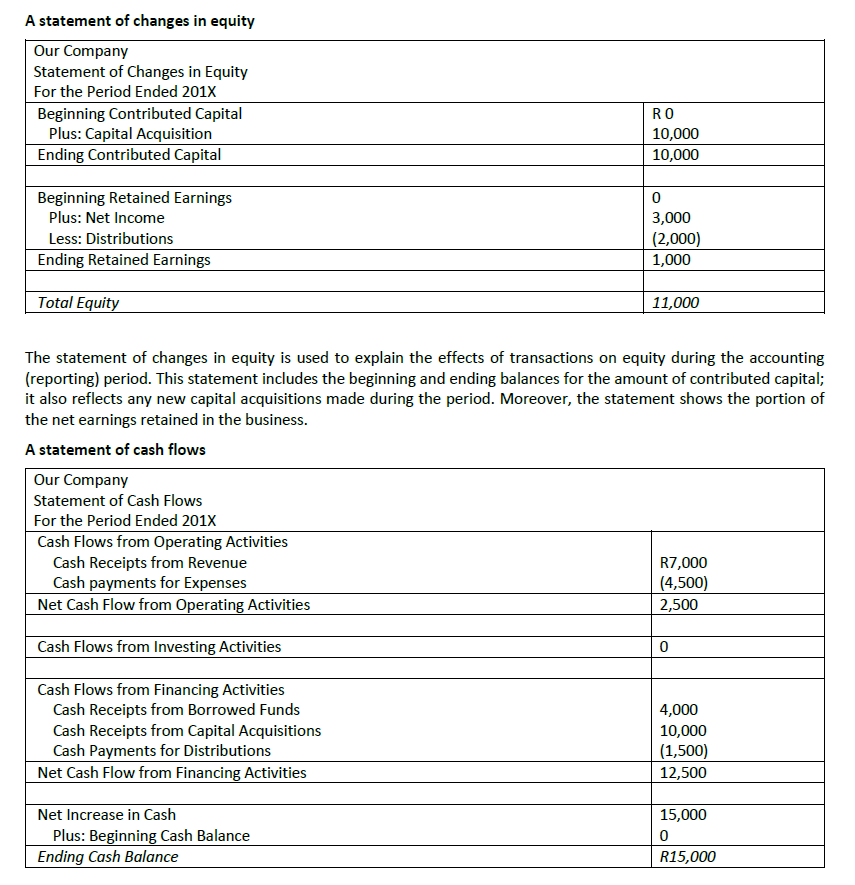
The statement of retained earnings
The statement of retained earnings is developed after the statement of comprehensive income (income statement)
because it uses data from the statement of comprehensive income (income statement). The net income from the
statement of comprehensive income (income statement) is either retained by the firm or paid out as dividends or a
combination of both.
The statement of financial position (balance sheet) and the accounting equation
The business firm’s statement of financial position (balance sheet) shows how much money the firm is worth — its
net worth. The balance sheet items are stated in terms of book value. The two sides of the accounting equation
mirror the format of the balance sheet. The two sides of the balance sheet have to balance since every asset has to
be purchased with either a liability, like a bank loan, or owner’s equity, such as a portion of the retained earnings.
The balance sheet is an indicator of net worth while the statement of comprehensive income (income statement) or
statement of profit and loss is an indicator of profitability.
The statement of cash flows
The statement of cash flows uses data from both the Statement of Comprehensive Income (income statement) and
Statement of Financial Position (balance sheet). It is the financial statement that is developed last due to this fact.
THE ROLE OF BUDGETING AND FORECASTING IN STRATEGIC PLANNING
Strategic planning is a structured and coordinated approach for developing long-term organisational goals and for
developing strategies to accomplish them. It is typically used to facilitate communication, to accommodate divergent
interests, and to foster decision making through leadership and consensus building.
One of the primary purposes of strategic planning is to set the stage for the annual budget process, providing a
roadmap for annual resource allocation decisions.
The budget process consists of activities that encompass the development, implementation, and evaluation of a plan
for the provision of services and capital assets.
Budgeting is implementing a business plan on paper before any resources are committed to production; it helps you
predict the consequences of an adjustment in your operation before ever making the adjustment. While records
serve as a record of the past, budgets are an anticipation of the future. After budgets are done, they become a
standard for monitoring what actually happens in the operation.
Budgets are usually compiled and re-evaluated on a periodic basis. A budget is a tool that managers use to translate
future plans into quantitative terms. Through budgeting, managers ensure that they have the resources available to
carry out the plans to reach the organisation’s goals.
Depending on the nature of the business, detailed plans may be formulated for the next few months, the next year,
the next 5 years, or even longer.
A company engaged in heavy construction is constantly submitting tenders that may or may not be successful;
therefore, it cannot plan as far ahead as an electric utility company. The utility company can base its projections on
population growth, which is predictable for 5- to 10-year periods. It must plan asset acquisitions years ahead,
because of the long lead times involved in constructing dams, nuclear power plants, etc.
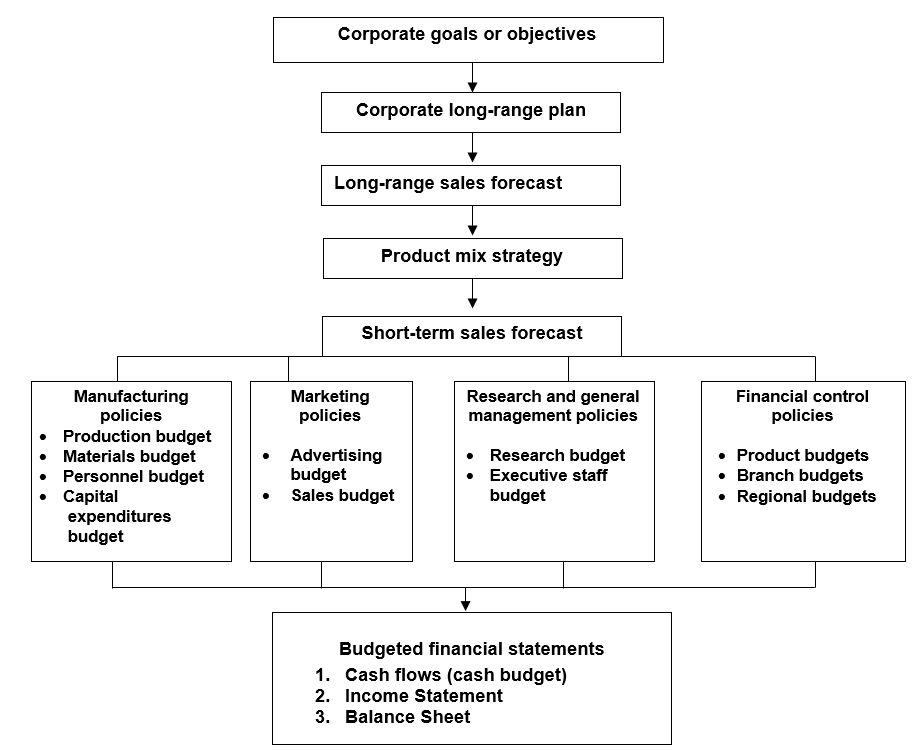
The budget system of an organisation provides an integrated picture of the organisation’s operations as a whole. It
enables the manager of each business unit to see the relation of his/her part of the enterprise to the totality of the
company.
The total budgeting process in an organisation can be depicted as follows:
At the outset you need to establish what positive expectations – goals – you have for your business and the plans you will put in place to help you reach those goals. Goal-setting is a critical factor because without a target, there is nothing to aim for and little chance of anything being hit or achieved.
A budget provides a good way of directing your business towards goals in terms of both expenses and revenues. It gives a constant overview of costs incurred and revenues raised, which then allows for the micro control of both of those elements.
Communicate your long-term plan to all concerned with drawing up budgets. Get the right people involved from the start. Internally, staff members with financial responsibilities should definitely have a role, as well as those who head specific projects, and those accountable for devising sales targets and production costs.
THE ACCOUNTING CONVENTIONS APPLIED IN FINANCIAL MANAGEMENT
In drawing up accounting statements, whether they are external “financial accounts” or internally-focused “management accounts”, a clear objective has to be that the accounts fairly reflect the true “substance” of the business and the results of its operation. The theory of accounting has, therefore, developed the concept of a “true and fair view”. The true and fair view is applied in ensuring and assessing whether accounts do indeed portray accurately the business’ activities.
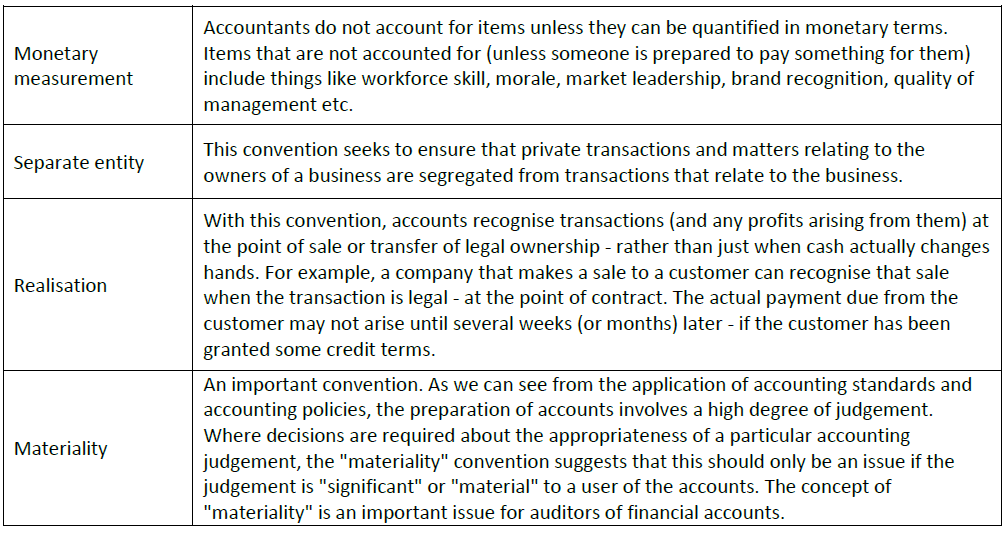
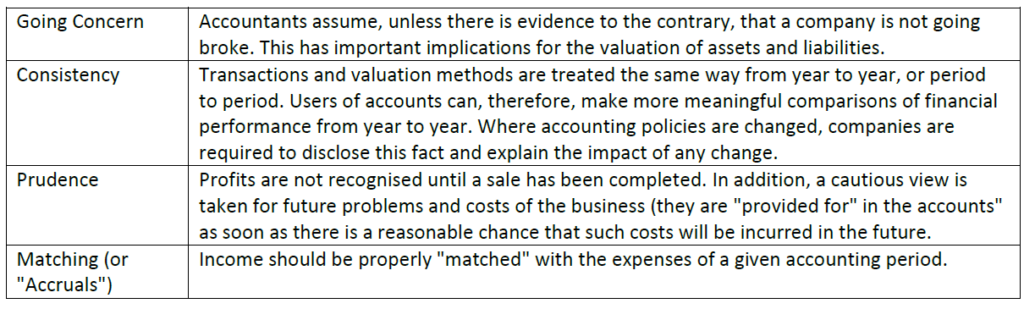
To support the application of the “true and fair view”, accounting has adopted certain concepts and conventions which help to ensure that accounting information is presented accurately and consistently.
Accounting conventions12
The most commonly encountered convention is the “historical cost convention”. This requires transactions to be recorded at the price ruling at the time, and for assets to be valued at their original cost. Under the “historical cost convention”, therefore, no account is taken of changing prices in the economy. The other conventions you will encounter in a set of accounts can be summarised as follows:
Accounting concepts
Four important accounting concepts underpin the preparation of any set of accounts:
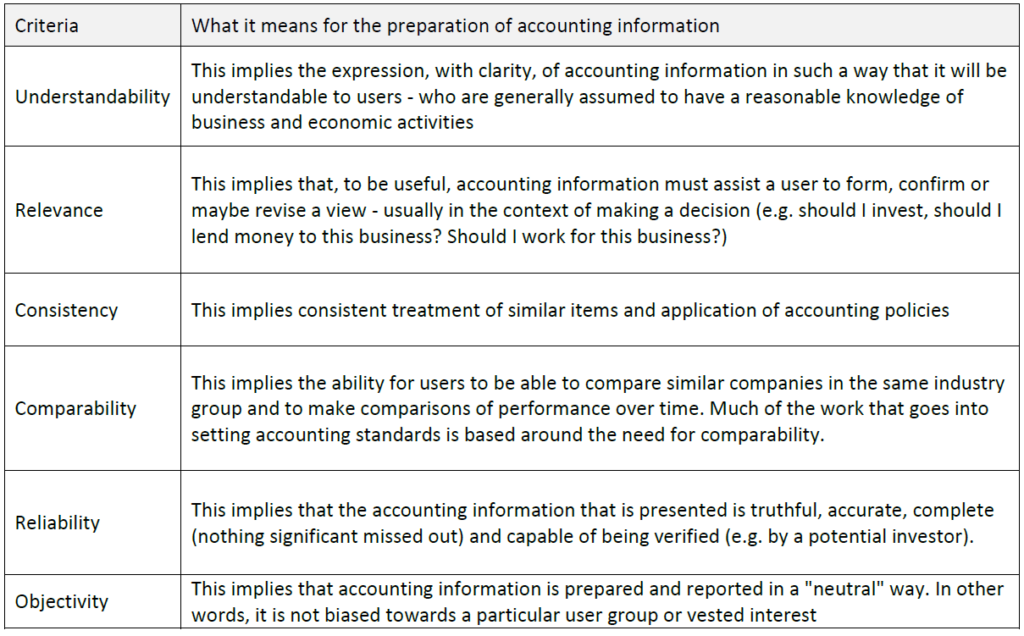
Key characteristics of accounting information
There is general agreement that, before it can be regarded as useful in satisfying the needs of various user groups,
accounting information should satisfy the following criteria:
THE FINANCIAL REPORTS PUBLISHED IN THE ORGANISATION
The organisation is required to create the following financial statements. These financial statements are what we will be using later in order to do a financial analysis:
A statement of financial position (balance sheet)
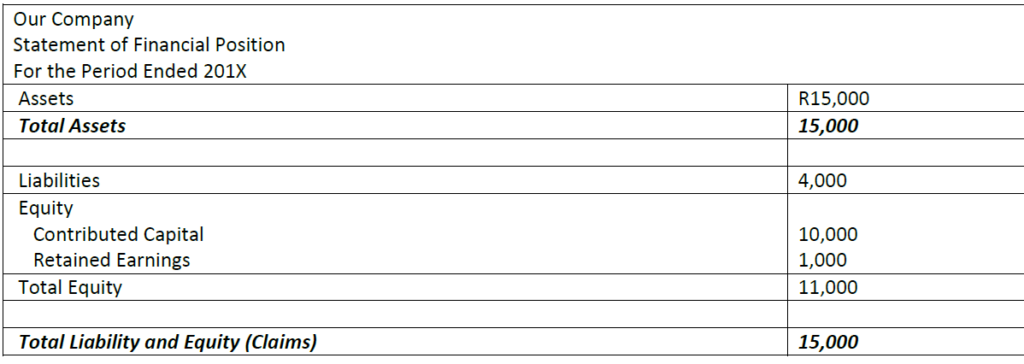
The statement of financial position (balance sheet) lists the assets and the corresponding claims (i.e., liabilities and equity). Logically, the assets must have the source, so they balance with the claims. That is why the total claims are equal to the total assets.
The statement of financial position is a good example of the use of the accounting equation:
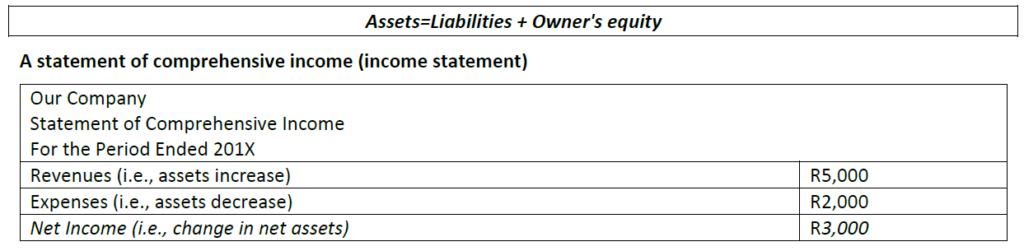
The statement of comprehensive income measures the difference between the assets increase and the assets decrease. The assets increase from the operating activities is labelled revenues. The asset decrease is called expenses. The difference between revenues and expenses is called net income (if revenues are greater than expenses) or net loss (if vice versa).
The statement of cash flows shows how a company obtained and used cash. The sources of cash are called cash inflows
and the uses are known as cash outflows. The statement classifies cash inflows and cash outflows into three
categories:
- Financing activities – describe the cash transactions associated with the resource providers (i.e., owners and
creditors); - Investing activities – include cash received or spent by the business on productive assets and investments in the
debt or equity of other companies; - Operating activities – explain the cash generated through revenue and the cash spent on expenses.
Notes to Financial Statements
Notes are added to the financial statements to explain what the figures cannot, such as how motor vehicles are
depreciated and to report on specifically high or low figures in the statements.
The notes to the financial statements (sometimes called footnotes) are also an integral part of the overall picture. If
the Statement of Comprehensive Income (income statement), Statement of Financial Position (balance sheet) and
statement of cash flows are the heart of the financial statements, then the footnotes are the arteries that keep
everything connected. If you aren’t reading the footnotes, you’re missing out on a lot of information.
The footnotes list important information that could not be included in the actual ledgers. Could you imagine if the
company listed out individual expenses on the Statement of Comprehensive Income (income statement) instead of
putting them under one or two neat headings? The Statement of Comprehensive Income (income statement) would
be 20 pages long!
The notes will list relevant things like outstanding leases, the maturity dates of outstanding debt and even details on
where the revenue actually came from. Generally speaking, there are two types of footnotes:
Accounting Methods – This type of footnote identifies and explains the major accounting policies of the business.
This portion of the footnotes will tell you the nature of the company’s business, when its fiscal year starts and ends,
how inventory costs are determined and any other significant accounting policies that the company feels that you
should be aware of. This is especially important if a company has changed accounting policies. It may be that a
organisation is practicing “cookie jar accounting” and is changing policies only to take advantage of current
conditions to hide poor performance.
Disclosure – The second type of footnote provides additional disclosure that simply could not be put in the financial
statements. The financial statements in an annual report are supposed to be clean and easy to follow. To maintain
this cleanliness, other calculations are left for the footnotes. For example, details of long-term debt such as maturity
dates and the interest rates at which debt was issued can give you a better idea of how borrowing costs are laid out.
Other areas of disclosure include everything from pension plan liabilities for existing employees to details about
ominous legal proceedings in which the company is involved.
The majority of investors and analysts read the statement of financial position (balance sheet), statement of
comprehensive income (income statement) and statement of cash flows but, for whatever reason, the footnotes are
often ignored.
In South Africa a directors’ report is to be included in the financial statements. This is a requirement of the
Companies Act 2008.
A financial audit is an independent evaluation performed for the purpose of attesting to the fairness, accuracy, and
reliability of financial data.
It is important to note that auditor reports on financial statements are only an opinion on whether the information
presented is correct and free of material misstatements, whereas all other determinations are left for the user to
decide.
Interpreting financial statements
Financial statements are used to do financial analysis. Financial statements are accounting reports prepared
periodically to inform the owner, creditors and other interested parties as to the financial condition and operating
results of the business.
Purpose of financial analysis
The purpose of financial analysis varies in every organisation, but generally it would include:
To determine whether the organisation achieved its main objective which is the maximisation of profit
To determine whether the organisation will be able to repay interest and capital on long-term loans
To determine whether an organisation will be able to service its short-term debts from liquid funds
To determine whether a company will be able to honour commitments relating to guarantees supplied
To establish if certain investments yield a fair and acceptable return
To establish whether a company has the potential to issue further ordinary shares, preference shares or
debentures
To establish, if an organisation is underperforming, what the problem areas are
To make recommendations in connection with the take-over, reconstruction or amalgamation of
organisations
To evaluate the ability of an organisation to pay personnel and supply other benefits to personnel
To establish tax policy
To prepare and use national income statistics
To regulate the operations of organisations
Financial analysis users
There are two broad categories of accounting information and financial analysis users:
External
Internal
External users
Accounting information that is designed to satisfy the needs of resource owners (external users) is called financial
accounting. Investors, creditors and brokers, to name a few, represent external users; they are interested in a company
because they have money invested, etc.
Internal users
Managerial accounting provides information that is useful to internal users in running a business. The group of internal
users includes managers, employees and unions that show interest in accounting information due to their direct
concern in the prosperity of a business.
Users and their information requirements13
From the above, you will realise that there are many users of financial analysis information, such as:
Management – Management is interested in information contained in the financial statements in order to carry out
its planning, decision making and control responsibilities
Owners – Regardless of the form of the enterprise, the owners, partners, members, trustees and shareholders will
be interested in the total financial well-being of the enterprise. This includes the profit potential, financial stability
and growth potential. Owners need information to assist them in deciding if they should buy, sell or retain their
investment.
Potential investors – The providers of risk capital and their advisors (brokers, auditors, economists) are concerned
with the risk inherent in and return provided by, their investment and also the ability of the enterprise to pay
dividends
Employees – Employees and their representative groups (e.g. trade unions) are interested in information pertaining
to the stability and profitability of employers. They are also interested in information which enables them to assess
the ability of the enterprise to provide remuneration, retirement benefits and employment opportunities.
Lenders of money – Lenders of money are interested in information enabling them to assess whether their loans
and the interest payable on these loans, will be paid when due
Suppliers and other trade creditors – Suppliers and other creditors are interested in information enabling them to
establish whether amounts owing to them will be paid when due. Trade creditors, as opposed to lenders, are likely
to be interested in an enterprise over a shorter period, unless they are dependent on the enterprise (being a major
customer) for their continued existence.
Customers – Customers are interested in information about the continued existence of an enterprise if they are
involved with it over the long term or if they are dependent on the enterprise being their chief supplier
Governments and their agencies – Governments and their agencies are interested in the allocation of resources and
therefore, the activities of enterprises. Agencies such as these would include the Receiver of Revenue, the
Departments of Statistics, Trade and Industry, Health and so forth. These agencies require the information in order
to regulate the activities of enterprises, to determine taxation policies and as the basis for national income and other
similar statistics.
The public and consumer organisations – Enterprises affect members of the public in a variety of ways. For
instance, enterprises may make a substantial contribution to the local economy in many ways, including the number
of people they employ and their patronage of local suppliers. Financial statements may assist the public by
supplying information in connection with trends and recent developments in the prosperity of the enterprise and the
range of its activities.
Management of an organisation needs to measure the success of their activities. Their success needs to be measured
relative to their past performance as well as their competitors. Financial analysis is not easy as there are many ways
of interpreting data that is often complex and voluminous.
ANALYSE FINANCIAL STATEMENTS
The primary financial statements of a company are prepared in order to provide information to the users of these
statements to help them make economic decision. Such decisions are made within the context of environmental
factors which impact on the company. The analysis of financial statements must therefore be conducted with insight
into the expected economic conditions which will prevail in the industry and economy.
The main considerations in every analysis are:
To establish the purpose of the analysis that needs to be done
Only when the purpose of the analysis is defined is it possible to select the appropriate ratios and items for
analysis
The results of the analysis are then compared and evaluated in a trend analysis
Finally, the decisions require a prediction based on the ratio and trend analysis
Financial analysis is used to fulfil one of the key challenges facing an organisation – establishing how well the
organisation is performing. This is also known as a financial health check or organisational viability and is also
referred to as organisational sustainability.
Trends and ratios
Using trends and ratios to analyse financial reports provides the organisation (management) with an understanding
of financial information.
In assessing the significance of various financial data, experts engage in ratio analyses, the process of determining
and evaluating financial ratios. A financial ratio is a relationship that indicates something about a company’s
activities, such as the ratio between the company’s current assets, current liabilities or between its accounts
receivable and its annual sales. The basic sources for these ratios are the company’s financial statements that
contain figures on assets, liabilities, profits, or losses.
Financial analysis is done by doing a comparative analysis. It is conducted by setting consecutive Statement of
Financial Position (balance sheet), Statement of Comprehensive Income (income statement) or statement of cash
flow side-by-side and reviewing changes in individual categories on a period to period multi-period basis. The most
important item revealed by comparative financial statement analysis is trend.
Financial ratios are only meaningful when compared with other information. Since they are most often compared
with industry data, ratios help an individual understand a company’s performance relative to that of competitors;
they are often used to trace performance over time.
Ratio analysis can reveal much about a company and its operations. However, there are several points to keep in
mind about ratios14:
First, financial statement ratios are “flags” indicating areas of strength or weakness. One or even several
ratios might be misleading, but when combined with other knowledge of a company’s management and
economic circumstances, ratio analysis can tell much about a corporation.
Second, there is no single correct value for a ratio. The observation that the value of a particular ratio is too
high, too low, or just right depends on the perspective of the analyst and on the company’s competitive
strategy.
Third, a ratio is meaningful only when it is compared with some standard, such as an industry trend, ratio
trend, a ratio trend for the specific company being analysed, or a stated management objective
In trend analysis, financial ratios are compared over time, typically years. Year-to-year comparisons can
highlight trends, pointing to the need for action. Trend analysis works best with five years of data.
Ratio analysis
Ratio analysis involves expressing one piece of financial information (for example profit) in terms of another (for
example total assets). Ratio analysis cannot be performed using only one set of figures.
Ratio analysis involves the comparison of ratios either with ratios of other companies and/or with previous ratios
within the same organisation.
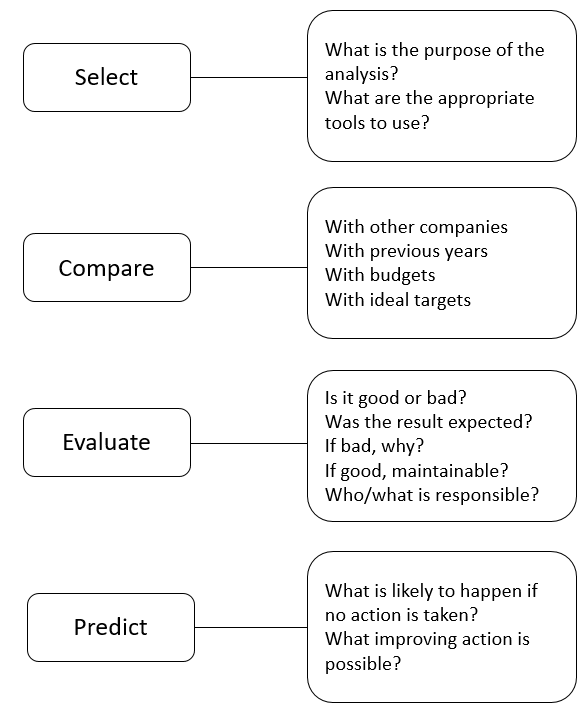
Step 1: Selection for ratio analysis
There are many possible ratios which could be selected. The objective of the analysis is the criteria used when deciding
upon the relevant ratios to be selected. The analyst must be convinced that the number and denominator line items
selected have a relationship which is meaningful. It is probable that a number of relevant ratios may be identified and
selection from among these will be necessary to avoid information overload. You need to identify:
What is the purpose of the analysis?
What are the appropriate tools to use?
Step 2: Comparison of ratio analysis
The use of ratios for comparison between companies is limited by the differing accounting policies and the lack of
uniformity in disclosure between organisations’ financial statements. This makes the comparison of ratio outcomes
difficult between organisations. You need to identify who or what you are going to compare the ratio analysis with:
With other companies
With previous years
With the industry
With budgets
With ideal targets
Step 3: Evaluation of ratio analysis
Factors such as the size of a company, outside influences on the company during the period under review, seasonal
differences which arose within the period bounded by the two Statement of Financial Position (balance sheet) dates
and which may not be reflected in either of the two Statements of Financial Position (balance sheets), must be noted
when evaluating the ratio analysis. You need to identify:
Is it good or bad?
Was the result expected?
If bad, why?
If good, maintainable?
Who/what is responsible?
Step 4: Prediction based on ratio analysis
The decision to be made resulting from the analysis of historic data will require taking many variables into
consideration for the present and future. The usual judgement must be exercised as any mechanical application is
likely to be questionable. You need to identify:
What is likely to happen if no action is taken?
What improving action is possible?
Ratios are calculated to provide you with information about four aspects of a business’s operations:
Profitability
Liquidity
Efficiency
Leverage
Note: The categories must not be considered to be mutually exclusive, as the selection of a ratio for the primary
purpose of establishing liquidity for example, may include a ratio with we have place into the efficiency category.
To summarise:
To do a financial analysis, the manager needs to establish the purpose of the analysis. Once the purpose of the analysis
has been established, the approach usually follows the typical stages illustrated below:
Apply ratios to measure profitability and liquidity
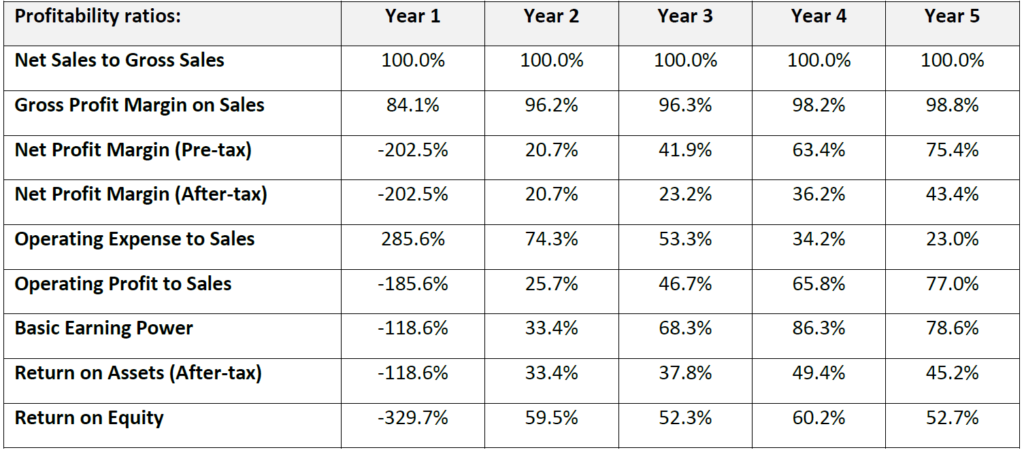
Profitability ratios
Profitability ratios determine if returns will be generated to ensure the sustainability of an organisation. They attempt
to reflect the profit per rand of sales or the profit per rand or capital invested.
Profitability ratios offer a glimpse into a company’s operational performance and help business owners determine if
they are maximising their bottom line. They also offer insights into the return a company is generating from its assets
and invested capital. These ratios should be compared on a period over period basis (i.e. year to year).
While these ratios may vary from industry to industry, standard profitability ratios include:
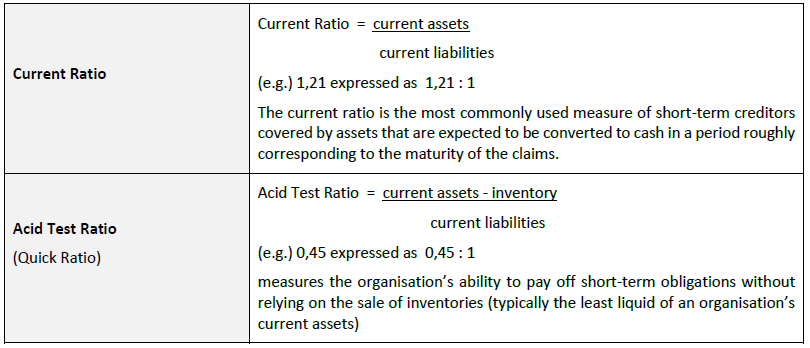
Liquidity ratios15
Liquidity ratios help you determine your company’s ability to generate sufficient amounts of cash to meet any current
or short-term obligation.
Liquidity ratios focus on a company’s ability to pay its bills when they come due. Bankers and suppliers use liquidity
ratios to measure a company’s creditworthiness. If liquidity ratios remain relatively high for a prolonged period, too
much capital may be invested in liquid assets (for example, cash, short-term investments, accounts receivable,
inventory) and too little capital may be devoted to increasing shareholder value. If liquidity ratios remain relatively
low, a company may not have sufficient liquidity to meet ongoing financial obligations.
Liquidity ratios include:
APPLY RATIOS TO MEASURE WORKING CAPITAL AND ASSET UTILISATION
Efficiency ratios enable you to evaluate how effectively your company uses its fixed and current assets. Assets are
compared to turnover to see how the relative use of assets over the period has performed in generating sales rands.
Turnover or efficiency ratios measure the activity or changes in certain assets, including accounts receivable,
accounts payable and inventory. Poor turnover generally indicates resources are invested in non-income producing
assets. The ratios presume that a “proper” balance should exist between sales and the various asset accountsinventories,
accounts receivable, fixed assets and others.
Efficiency ratios include:
Source: http://www.bizplanit.com/financial-plan-financial-ratios/
Working capital turnover ratio
This ratio represents the number of times the working capital is turned over in the course of year and is calculated as
follows:
Formula of working capital turnover ratio:
Following formula is used to calculate working capital turnover ratio
Working capital turnover ratio = Cost of sales / net working capital
The two components of the ratio are cost of sales and the net working capital. If the information about cost of sales
is not available, the figure of sales may be taken as the numerator. Net working capital is found by deduction from
the total of the current assets the total of the current liabilities.
Example:
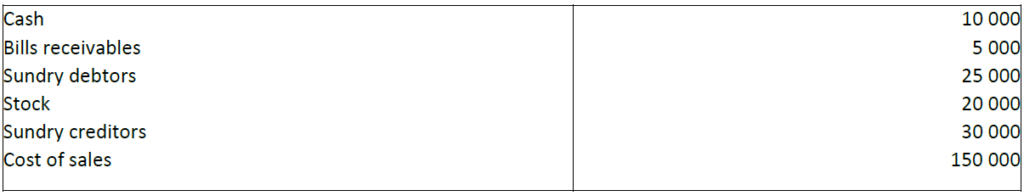
Calculate working capital turnover ratio
Calculation:
Working capital turnover ratio = Cost of sales / net working capital
Current assets = R10 000 + R5 000 + R25 000 + R20 000 = R60 000
Current liabilities = R30 000
Net working capital = Current assets – current liabilities
= R60 000 − R30 000
= R30 000
So the working Capital Turnover Ratio = 150 000 / 30 000
= 5 times
Significance:
The working capital turnover ratio measures the efficiency with which the working capital is being used by a firm. A
high ratio indicates efficient utilisation of working capital and a low ratio indicates otherwise.
However, a very high working capital turnover ratio may also mean lack of sufficient working capital which is
obviously not a good situation.
APPLY RATIOS TO MEASURE RETURN
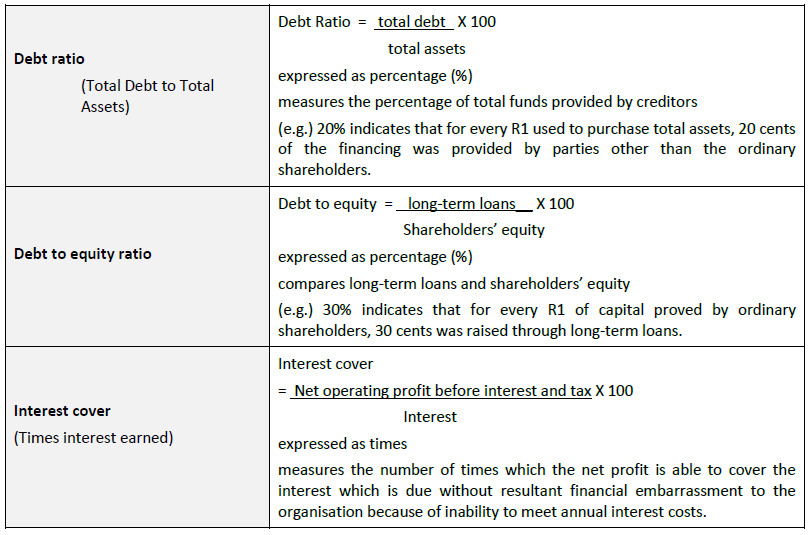
Leverage ratios
Leverage ratios provide information about a business’s ability to meet its long-term obligations. These ratios examine
the financing structure of the business. They focus on the combination of owner’s equity and outside financing (long
and short term) used by the company.
Leverage ratios indicate how well a company’s uses borrowed funds (rather than stockholders’ equity or investments)
to expand its business. The goal is to borrow funds at a low interest rate and invest in a business activity that produces
a rate of return exceeding the target rate of return for investments.
Leverage ratios include:
Leverage ratios, which measure the funds supplied by owners as compared with the financing provided by the
organisation’s creditors, have a number of implications:
First, creditors look to the equity, or owner-supplied funds, to provide a margin of safety. If owners have
provided only a small proportion of total financing, the risks of the organisation are borne mainly by the
creditors.
Second, by raising funds through debt, the owners gain the benefits of maintaining control of the
organisation with a limited investment.
Third, if the organisation earns more on the borrowed funds than it pays in interest, the return to the
owners is magnified. For example, if assets earn 6 percent and debt costs only 4 percent, there is a 2
percent differential accruing to the stockholders.
Leverage cuts both ways, however; if the return on assets falls to 3 percent, the differential between that figure and
the cost of debt must be made up from equity’s share of total profits. In the first instance, where assets earn more
than the cost of debt, leverage is favourable, in the second, it is unfavourable.
Organisations with low leverage ratios have less risk of loss when the economy is in a recession, but they also have
lower expected returns when the economy booms. Conversely, organisations with high leverage ratios run the risk
of large losses but also have a chance of gaining high profits. The prospects of high returns are desirable, but
investors are averse to risk. Decisions about the use of leverage, then, must balance higher expected returns against
increased risk.
In practice, leverage is approached in two ways:
- One approach examines Statement of Financial Position (balance sheet) ratios and determines the extent to which
borrowed funds have been used to finance the organisation. - The other approach measures the risks of debt by Statement of Comprehensive Income (income statement) ratios
designed to determine the number of times fixed charges are covered by operating profits. These sets of ratios
are complementary and most analysts examine both leverage ratios.
MAKE RECOMMENDATIONS BASED ON RATIO ANALYSIS
One of the uses of ratios is to determine the profitability of an organisation. Profitability is an indicator of the
viability of an organisation or its ability to sustain itself into the future.
An organisation uses profitability ratios to determine the financial health of the organisation. This type of analysis is
of interest to many different parties, such as:
The board of directors will use these to analyse the financial health of the organisation. This will assist in the
measurement of how well their strategic objectives have been met in the past as well as helping to plan their
future strategy based on the current strength of the organisation.
Department managers will use these ratios to assess the profitability and sustainability of their business
units.
External users, such as shareholders and providers of capital and finance to the organisation will use these
ratios to help determine the level of risk that they face in terms of their investments or lendings.
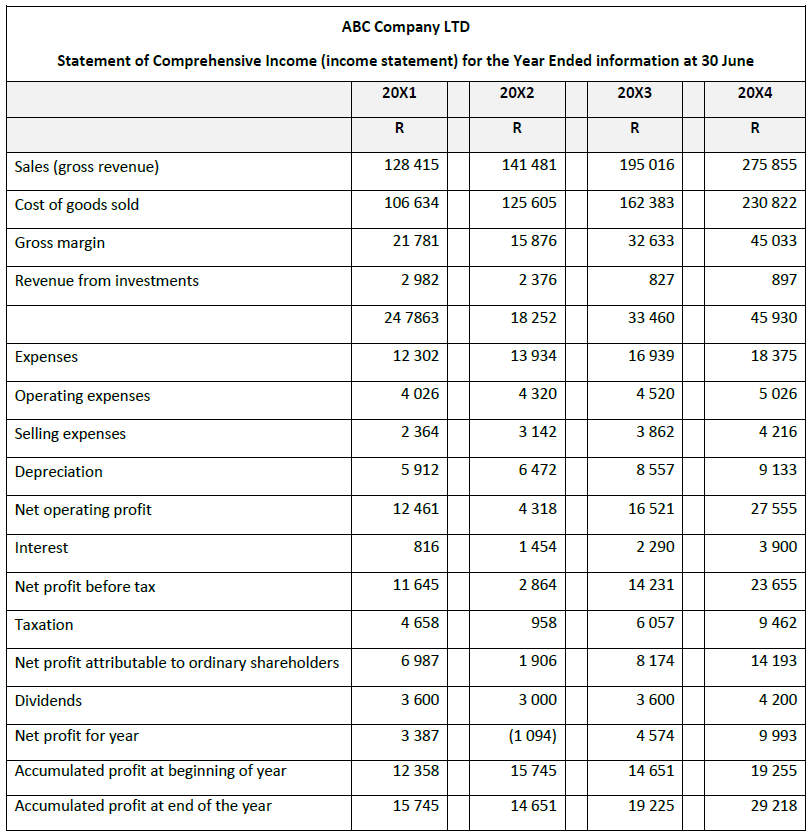
We will use information from the following Statement of Financial Position (balance sheet) and Statement of
Comprehensive Income (income statement) summaries to work through some examples. We will refer to this set of
information as Document Set 1.
ABC Company is a retail company with its main business being the purchase of CD’s from manufacturers, which are
then sold in bulk to retail outlets and music shops. The figures provided below are not set out in accordance with IFRS,
but rather as a financial analyst would prepare them – in a spreadsheet format.
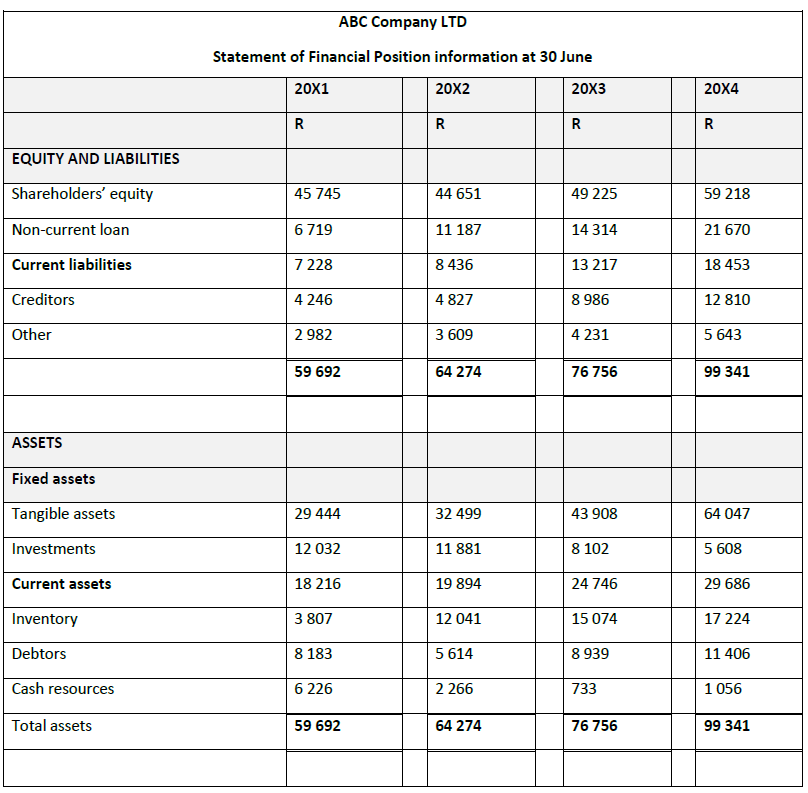
Additional information from financial statement notes:
All sales and purchases are on credit
Information for the previous accounting year: Sales R119 122
Note: The 20X4 figures from Document Set 1 are used to illustrate calculation of all the ratios which follow in the
rest of the learner guide.
Applying Ratios to measure Profitability
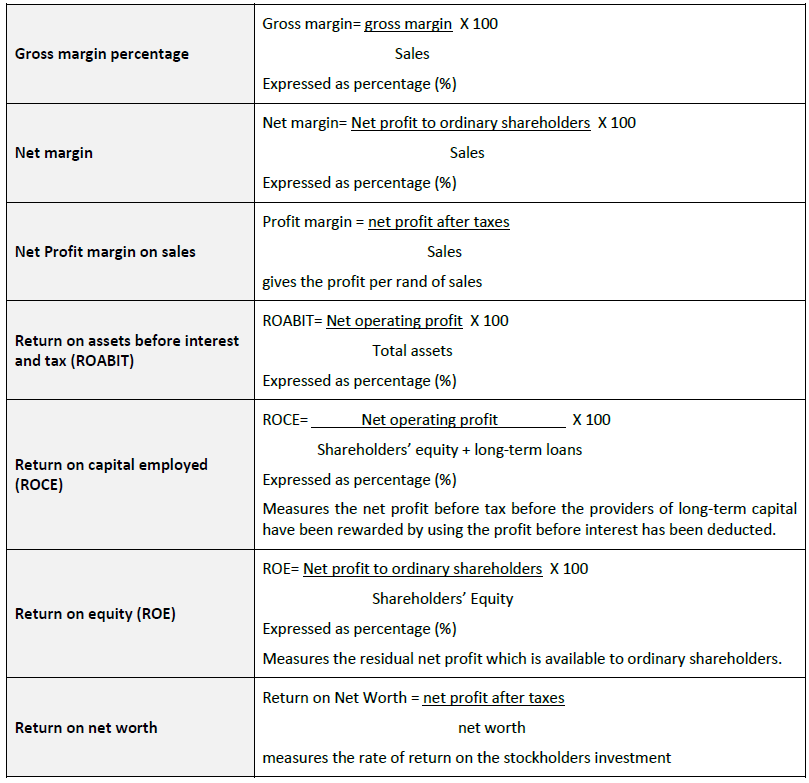
We have selected five primary aspects of profitability which are commonly identified in various industries. The
ratios attempt to reflect the profit per rand of sales or the profit per rand of capital invested, such as:
Gross margin
Net margin
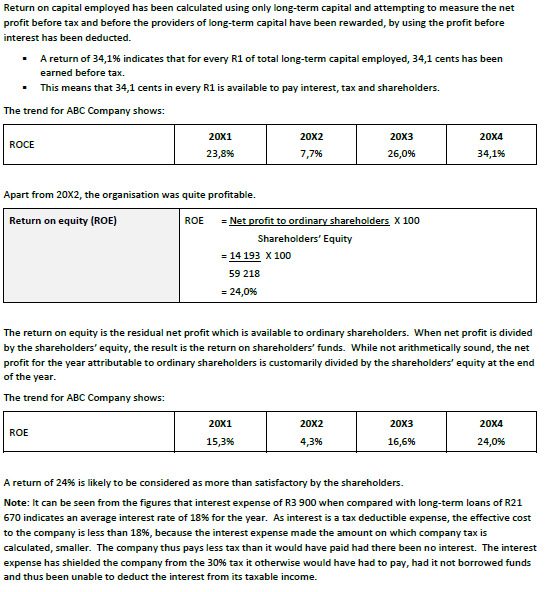
Return on assets before interest and tax
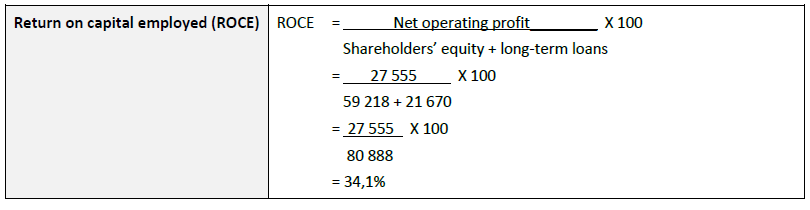
Return on capital employed
Return on equity
Note: The 20X4 figures from Document Set 1 are used to illustrate calculation of all the ratios which follow in the
rest of the learner guide.

This ratio indicates the percentages by which the total selling price is greater than the cost prices.
A gross margin percentage of 16,3% indicates that for every R1 of sales, 16,3 cents was gross profit. The
remaining 83,7 cents in each rand is the cost price of the goods.
The trend for ABC Company shows:

When comparing this with previous years, the ratio has dropped from 17,0% in 20X120X1 to the current 16,3%. It is
apparent that ABC Company had pressure on its gross margin in 20X2, as its gross margin fell to 11,2 %. This could
have been from two sources:
Pressure on selling prices as a result of competition in the industry
Upward pressure on costs as a result of inflation or other cost factors.
It is important to note that the rand amount of gross margin has more than doubled over the period as a
result of the growth of sales.

This ratio indicates the percentages by which the total selling price eventually becomes net profit.
The net margin percentage of 5,2% indicates that for every R1 of goods sold, 5,2 cents eventually becomes
profit attributable to the ordinary shareholders.
If turnover increases, then each time R1 is received, 5,2 cents will accrue to ordinary shareholders as net profit.
The faster the turnover, the greater will be the accumulation of 5,2 cents and the larger the ultimate net profit.
The trend for ABC Company shows:

The net margin has followed similar trend to that of the gross margin, with the percentage achieved in 20X1 being
the high point.
It would seem that following the slump in 20X2, ABC Company has recovered well and it is likely that the net margin
will increase in 20X5.
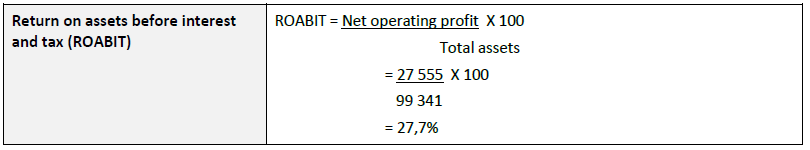
ROABIT ratio indicates how well total assets have been used in earning profit, before any parties are rewarded by
distribution of the profit, including the South African Revenue Service (SARS) in the form of tax ad the providers of
debt capital by way of interest.
Every rand invested in total assets earned 27,7 cents
The trend for ABC Company shows:

The ROABIT has had a drastic drop in 20X2 and 20X4 is the best achievement in the four-year period.
Applying Ratios to measure Working Capital and Asset Utilisation
We have selected five ratios to assess the efficiency of the company in managing its fixed and current assets. Assets
are compared to turnover to see how the relative use of assets over the period has performed in generating sales
rands. The three most important working capital items are also tested to determine whether they have been
efficiently used. The five ratios which we will be calculating are:
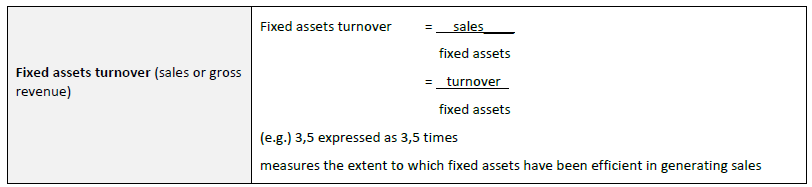
Fixed assets turnover
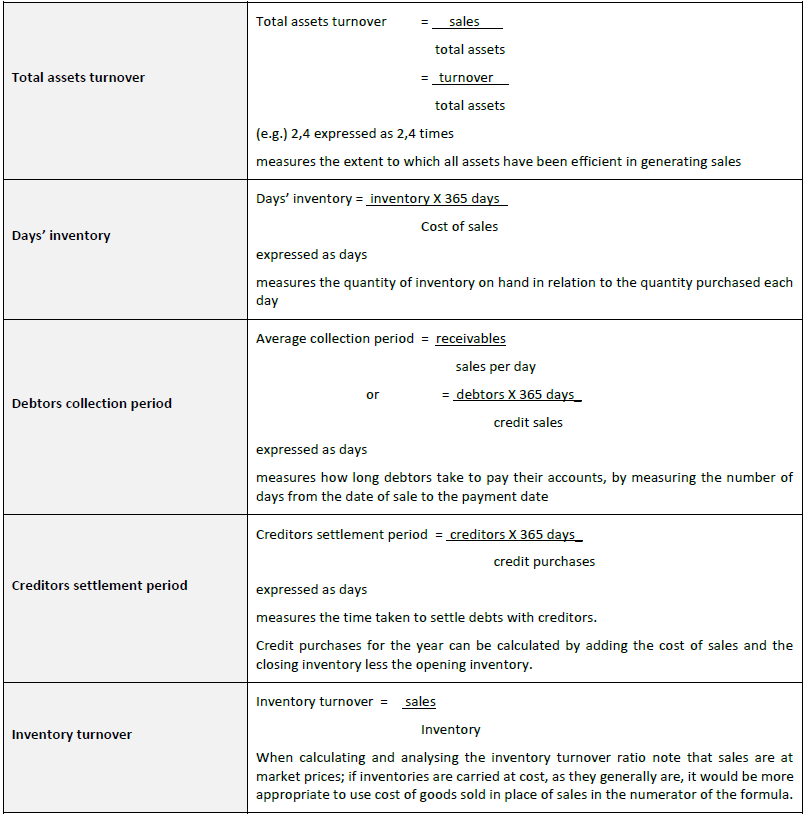
Total asset turnover
Days’ inventory
Debtors collection period
Creditors settlement period
Note: The 20X4 figures from Document Set 1 are used to illustrate calculation of all the ratios which follow in the
rest of the learner guide.
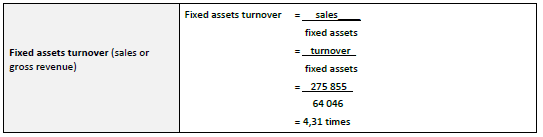
The fixed assets turnover measures the extent to which fixed assets have been efficient in generating sales.
It indicates that for every R1 invested in fixed assets, R4,31 was generated in sales during 20X4.
The trend for ABC Company shows:

The trend over the four-year period has been consistent and this is a good indicator of stability in non-current
tangible asset management.

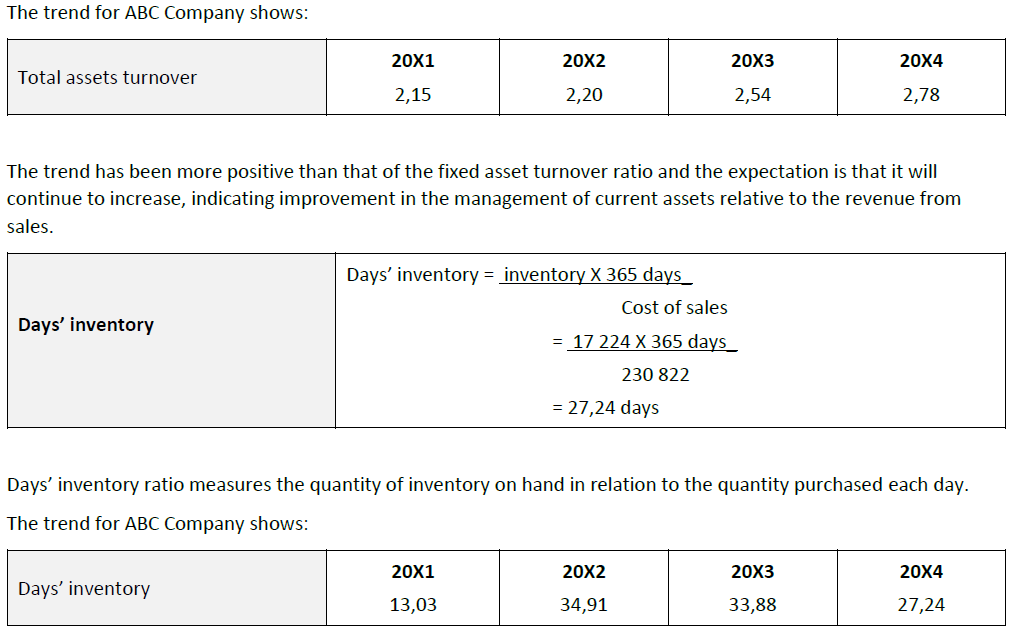
The number of days’ inventory has shown considerable fluctuation over the four-year period.
The major difference between 20X1 and 20X2 may have arisen as a result of a change in policy to keep more
inventory on hand, or may have resulted from the decline in trading activity in 20X2 which is evident in all the
ratios for that year.
It appears that inventory is beginning to move more quickly and the improvement to 27,24 days in 20X4 may
signal an attempt to return to the efficiency which was achieved in 20X1.
Inventory is clearly the most significant current asset. Changes in this ratio have an impact on the current ratio
as can be from the trends in these two ratios over the last three years.

The debtors collection period shows how long debtors take to pay their accounts, by measuring the number of days from the date of sale to the payment date.
- The debtors collection period assumes that all sales are on credit. While this may not always be the case, the comparisons do provide useful information.
The trend for ABC Company shows:

This period has fluctuated from a short collection period of 14,48 days in 20X2 to a high of 23,26 days in 20X1.
- This current year’s figure of 15 days seems to be within the range maintained apart from the unfortunate lapse in 20X1.

To calculate the time taken to settle debts with creditors, the credit purchases for the year must be known. As the opening and closing inventory as well as the cost of sales for each year are known, it is possible to calculate credit purchases, assuming that all purchases take place on credit:


The creditors settlement period measures how long it takes the company to pay its creditors. It is determined in the same way as the debtors collection period, except that creditors and cost of sales are substituted for debtors and sales respectively.
The trend for ABC Company shows:

Creditors are settled promptly although it is apparent that in the last two years, ABC Company has adopted a policy of keeping the creditors waiting marginally longer.
- This may be a symptom of its liquidity problems and scrutiny of the Statement of Financial Position (balance sheet) indicates that very low bank and cash resources are currently on hand.
- Note that sound management of working capital would try to ensure that the debtor’s collection period is shorter than the creditors payment period, an objective which has only been achieved in recent years.
Making Recommendations after an Analysis
Once the ratio and trend analysis has been done, the analyst is in a position to make certain recommendations based on the outcome of the analysis. The components of the calculations are used to create a better outcome of future analysis and to make the required recommendations.
See Appendix A for an example of such an analysis report.
Describing and preparing financial forecasts
Business entities need to plan for the future; they must also consider alternative management strategies and prepare capital and operating budgets; in addition, they must consider alternative funding and cash budget possibilities. An important part of the planning process is the preparation of prospective financial statements that attempt to predict the outcome of the business entity’s activities in future periods.
Financial forecasts and financial projections are prospective financial statements that present an entity’s expected financial position, results of operations, and cash flows in future periods under two different conditions.
Financial forecasts assume that the entity will continue to function in the manner in which it is currently functioning. For example, that a retail store chain will continue to do business in the manner in which it is currently engaged. The financial forecast presents the predicted results for the next year.
Financial projections, on the other hand, make one or more hypothetical assumptions about an entity’s future course of action. For example, if the retail store chain were considering a Website at which it would also sell merchandise – in addition to the merchandise sold in the stores – a financial projection would provide expected results. Financial forecasts and projections should be distinguished from pro forma financial statements, which show the effect of a hypothetical future event on the historical financial statements results16.
It is critical to your business success that you prepare realistic forecasts of your future business performance. You need to forecast your operations for three to five years in order to guide your business growth. You will need realistic forecasts to support your business plan if you need a loan or investor funds. The elements of and influences on pro forma statements include17:
Prior Financial Statements
Of course you will have to use previous financial statements if your business has been operating for some time. From your prior financial statements, you will use sales and revenue levels, business ratios, average expenses, and any relevant information about your accounts receivable or payable. You should expect your prior financial statements to show financial improvement for each year of operation.
Internal Factors
The status of your operations is important in preparing pro forma statements and projections. For example, you must consider whether your business needs to relocate due to expansion, or your business needs to buy expensive new equipment to replace older models. You also must consider your competition, how you are measuring up to them, and whether you need a new marketing plan to be more competitive. Also, consider whether your company needs additional personnel or additional training.
External Factors
The status of the country’s economy is very relevant to your company’s future. Certain businesses may be affected by the status of the global economy. It is important to understand the industry trends to be certain that your product or services will continue to be marketable.
Projected Financial Statement
The pro forma financial statements will include estimated future sales, expenses, and profits. These items need to be broken down in order to be meaningful. The sales estimates should state which salesperson, which department, or which region will generate the sales. The estimated expenses must be broken down into general and administrative, operating expenses, depreciation, and taxes.
Analysing Past Performance, Recognising Opportunities and Planning for the Future
Part of your role as a manager requires that you analyse past performance, recognise opportunities and plan for the future of your unit.
It’s easy to focus only on the day-to-day running of your business, especially in the early stages. But once you’re up and running, it can pay dividends to think about longer-term and more strategic planning.
This is especially true as you take on more staff, create departments within the business, appoint managers or directors and become distanced from the everyday running of the business.
Reviewing your progress will be particularly useful if you feel:
- uncertain about how well the business is performing
- unsure if you’re getting the most out of the business or making the most of market opportunities
- your business plan may be out of date, e.g. you haven’t updated it since you started trading
- your business is moving in a direction different to the one you had planned
- the business may be becoming unwieldy or unresponsive to market demands
Retrieved from: http://www.infoentrepreneurs.org/en/guides/review-your-business-performance/
Good decision making is an essential skill for career success generally, and effective leadership particularly. If you can learn to make timely and well-considered decisions, then you can often lead your team to spectacular and well-deserved success. However, if you make poor decisions, your team risks failure and your time as a leader will, most likely, be brutally short.
An organised and systematic decision-making process usually leads to better decisions. Without a well-defined process, you risk making decisions that are based on insufficient information and analysis. Many variables affect the final impact of your decision. However, if you establish strong foundations for decision making, generate good alternatives, evaluate these alternatives rigorously, and then check your decision-making process, you will improve the quality of your decisions.
“Why is it that some people recognise business opportunities where many others see only problems? Opportunities are everywhere, yet many people do not see them. Successful entrepreneurs, however, have the capacity to see what others do not”
Jeffry Timmons (1941–2008) Professor of Entrepreneurship, known as a pioneer of both entrepreneurship research and education
Successful business unit managers, too, have the ability to look at the successes and failures of the past and see opportunities for growth and doing things better.
All of your estimates and projections must logically flow from previous years’ financial statements, so that you have a benchmark or standard to evaluate future performance.
Identifying Opportunities for Growth
Once the analysis has been done, the analyst is in a position to identify where the organisation can change tactics and do things differently in order to create a better outcome of the ratio analysis and ensure growth.
Here are three easy ways to uncover potential opportunities18:
Examine your current client base
The cost of securing a new client can be anywhere from five to 15 times that of securing a repeat client. Consequently, developing strategies that generate repeat business on a regular basis is essential to a business’s bottom line. It goes without saying that you need to provide quality service in the first place for your clients to come back. But after a transaction is completed between you and a client, do you have ways to stay in touch and stay top of mind? Do you provide reasons and incentives for repeat businesses? Can you up sell some of your past and current clients with a new service or product you have? Do they have family, friends, and associates you can offer your services to? Assuming that you provided an excellent work to your clients, they can be your biggest fans who will gladly promote and endorse you.
Look at how you are currently receiving clients
A business’s client source is generally tied to its marketing effort. Besides identifying the appropriate marketing vehicles to reach your target clients, it is important to track the effectiveness of your tactics. Are your clients mostly through word of mouth referrals? Do they usually find you online? Are they typically attendees to speaking engagements you have throughout the year? Do your strategic alliances send the majority of your clients? Once you have identified the successful sources, explore creative ways to take those sources to the next level.
Identify complementary services/products that will open up a different market for you
Products and services that complement what you offer the market can affect the demand curve. For example, you may sell hot dogs, while a complementary business offers hot dog rolls. If the price of the hot dog rolls increases, it can cause the demand for hot dogs to decrease. As a result, the demand curve shifts to the left, and the price for hot dogs would also increase.
IDENTIFY TYPES AND FORMATS OF FINANCIAL FORECASTS
The following guidelines for preparation of financial forecasts are excerpted from the American Institute of Certified Public Accountants’ (AICPA) publication, Guide for Prospective Financial Information.
- Financial forecasts should be prepared in good faith. Good faith in this context includes making a diligent effort to develop appropriate assumptions and exercising care not to mislead a third-party reader. Good faith precludes preparing a financial forecast with either undue optimism or pessimism.
- Financial forecasts should be prepared with appropriate care by qualified personnel. Appropriate care means that diligence and proper attention should be exercised in the preparation of the financial forecasts.
- Financial forecasts should be prepared using appropriate accounting principles. The accounting treatment applied to events and transactions contemplated in financial forecasts should be the same as the accounting treatment expected to be applied in recording the events when or if they occur.
- The process used to develop financial forecasts should provide for seeking out the best information that is reasonably available at the time. The reliability of the basic data should be considered in the process of preparing the financial forecasts and the use of an appropriate level of detail is another key consideration.
- The information used in preparing financial forecasts should be consistent with the plans of the entity. Financial forecasts should be consistent with the expected economic effects of anticipated strategies, programs, and actions. An indication of the entity’s plans can often be found in its budgets, goals, and policies.
- Key factors should be identified as a basis for the assumptions. Key factors are those significant matters upon which an entity’s future results are expected to depend and are basic to the entity’s operations.
- Assumptions used in preparing financial forecasts should be appropriate. Recognising that assumptions are the essence of developing financial forecasts, the quality of the underlying assumptions largely determines the quality of financial forecasts. Assumptions should be reasonable and suitably supported.
- The process used to develop financial forecasts should provide the means to determine the relative effect of variations in the major underlying assumptions. Particular attention should be devoted to those assumptions (1) to which the attainment of forecasted results is particularly sensitive and (2) for which the probability of variation is high.
- The process used to develop financial forecasts should provide adequate documentation of both the financial forecasts and the process used to develop them. Documentation makes possible review and approval of financial forecasts by the responsible party. It facilitates comparison of the financial forecasts with actual financial results, and it provides the discipline necessary for developing reliable financial forecasts
- The process used to develop financial forecasts should include, where appropriate, the regular comparison of the financial forecasts with attained results. Comparison of prospective financial results with actual results for the prospective period and for prior periods for which financial forecasts were prepared provides an historical measure of success in developing financial forecasts.
- The process used to prepare financial forecasts should include adequate review and approval by the responsible party at the appropriate levels of authority. The ultimate responsibility should rest with the responsible party at the highest level of authority. The review should be conducted in sufficient depth to assure the responsible party of the soundness of the process used to develop the financial forecasts.
Trend Analysis
A trend analysis tries to predict the future movements of figures on financial statements and/or their ratios. Many people believe that history repeats itself, so it is important to analyse any trends from historical financial data in order to predict the future.
A comparison of financial statements over several years reveals the direction, speed and extent of a trend(s).
The analysis is done by restating the amount of each item or group of items as a percentage. Such percentages are calculated by selecting a base year and then assigning a weight of 100 to the amount of each item in the base year statement. Thereafter, the amounts of similar items or groups of items in prior or subsequent financial statements are expressed as a percentage of the base year amount. The resulting figures are called index numbers or trend ratios.
A trend analysis can be done in two ways, such as:
- Using a spreadsheet
2. Graphically
It is valuable to create charts of the comparisons done when trying to identify trends, as the charts would show various patterns or trends such as:
An analysis of trends can be done for the department or organisation when you compare different financial statement sets (per year) with each other. You can also do a trend analysis for an industry or compare your organisation with another – even if the other organisation is much bigger, by using the ratio analysis outcomes.
IDENTIFY SOURCES OF FINANCIAL FORECASTS
Your financial forecast will be based on information gathered from industry and market research. Since you will be responsible for achieving the predetermined financial objectives, make sure your estimates and assumptions are realistic. Be consistent and make sure that your financial forecast reflects the rest of the business plan. For example, your sales forecast should reflect the capacity of production equipment mentioned in the operational section.
Combine the components of your financial forecasts to generate projected financial statements, (balance sheet, profit and loss statement). You may need help from your accountant to assemble the figures in the conventional format, but the research and operational assumptions should be your own.
You can develop your own financial forecast by using the spreadsheets to complete the individual components. Then add the timing dimension (when you expect to receive payment and the amount) over 12 months to generate an annual cash flow forecast.
OUTLINE FACTORS IN PREPARING FINANCIAL FORECASTS
The preparation of prospective financial statements requires considerable knowledge of the organisation’s business and the factors that are likely to determine its future results. The following key factors19 related to future results must be considered in the preparation of such statements:
- Factors related to the specific entity
- Factors related to the industry
- Factors related to the market
- Factors related to the economy
Factors related to the specific entity. The principal cost elements of the entity’s doing business must be considered. Depending on the entity, these elements may include such costs as payroll and benefits, needed employees, raw materials, products the entity sells, freight or shipping, and advertising.
Another consideration is the availability of resources. For example, are the expert, specialised, or skilled workers available to meet the needs of the entity under the plan as initially proposed? Are the raw materials and/or products for resale available? Can the delivery system be organised to accomplish the task? Are the company’s physical facilities sufficient for the uses and for the capacities contemplated?
Factors related to the industry. Factors related to the industry in which the entity is operating must be considered. Is the industry one in which companies are very competitive? Are competitive industries emerging? Is obsolescence emerging within the industry? Are there regulatory considerations and requirements? Is new technology being introduced into the industry? What are the economic conditions within the industry?
Factors related to the market. Market factors must be considered. What are the trends in business or consumer demand related to the services or goods being sold by the entity? Are competitive companies emerging, perhaps with new or different products? Is unique marketing required? Are there pricing developments to be factored into the forecast?
Factors related to the economy. Numerous factors related to the economy must be considered. What are the economic conditions in the country? What are critical economic trends? Is the economy inflationary, deflationary, or stable? What is the trend with regard to labour availability? What are the financing considerations in relation to the economy? What are interest rates? Are there significant factors related to long-term versus short-term financing? Is a public stock offering a possible financing option?
INCORPORATE FACTORS IN THE PREPARATION OF FINANCIAL FORECASTS
When preparing the financial forecasts for your business unit you must take the factors impacting on the organisation into account in terms of how they relate to your business unit:
Factors related to the specific unit. The principal cost elements of the unit’s operation, such as staffing requirements, raw materials, and running costs.
Factors related to the industry. How does competition affect the work of the unit? Are you affected by obsolescence or outdated technology? Are there regulatory considerations and requirements? Is there still growth in your industry?
Factors related to the market. Is your product or service still in demand or do you have to look for innovative ways to create a new demand? Is your pricing still market-related?
Factors related to the economy. Factors related to the economy which will probably need to be considered in your unit are: strength of the rand, rate of inflation, supply of skilled labour and labour unrest, interest rates and the petrol price.
ANALYSE FINANCIAL FORECASTS TO DETERMINE VIABILITY20
The concept of the going concern is an important accounting concept. Financial Statements are usually prepared with the assumption that the enterprise is a going concern, without evidence to the contrary. This assumption implies that the business will continue its operations for the foreseeable future.
Financial viability implies that:
- The company will continue its operations in the foreseeable future.
- The enterprise is sufficiently profitable (or will be in the future) to continue its operations.
- There is inherent worth in continuing operations.
This is related to the concept of ongoing profits. It is important to note that sometimes companies do not make a profit every year – especially in the first few years of operations. A businessperson would examine financial statements for their financial viability and also take a view on the inherent worth of the company.
An analysis of profitability alone is not sufficient to determine the viability of an organisation. The capability of the organisation to pay its way in the future is important. The capacity of an organisation to pay its way depends on its level of liquidity.
Evaluating financial viability
In order to evaluate the financial viability of an organisation, a combination of the following information is required:
Financial performance – a measure of the difference (i.e. profit/loss, surplus/deficit) between revenue and expenses that arises from operations for a period of time
Financial position – the “position” at a point in time assessed in terms of assets, liabilities and public equity
Cash flow – the sources and uses of cash relating to operations, investing in assets and financing the organisation for a period of time
Using liquidity ratios to analyse the organisation’s viability
These ratios help to determine whether the company will be able to meet its financial obligations in the short term. It is a measure of liquidity reflected by the working capital, which is the difference between current assets and current liabilities. Two ratios have been selected, both of which are frequently used by management:
- Current ratio
- Acid test ratio
Note: The 20X4 figures from Document Set 1 are used to illustrate calculation of all the ratios which follow in the rest of the learner guide.
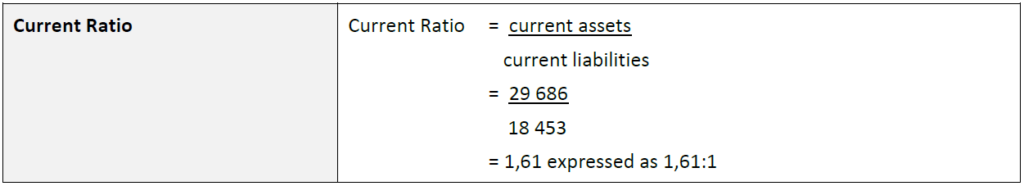
The current ratio is the most commonly used measure of short-term creditors covered by assets that are expected to be converted to cash in a period roughly corresponding to the maturity of the claims.
The trend for ABC Company shows:

The current ratio has shown a consistent decline over the four-year period, from a high of 2,52 in 20X1 to a low of 1,61 in 20X4.
From a scrutiny of the Statement of Financial Position (balance sheet) it is apparent that the current liabilities have increased relatively more than the current assets over the four-year period. This may be a cause for concern and ABC Company would be well advised to ensure that is has adequate cash resources on hand in order to meet its short-term commitments.
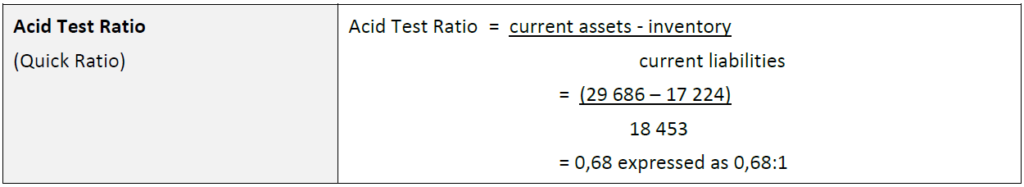
The Acid Test Ratio measures the organisation’s ability to pay off short-term obligations without relying on the sale of inventories (typically the least liquid of an organisation’s current assets).
- This ratio is the real test of liquidity as it removes inventory, which is not easily converted into cash, from the calculation of current assets.
- To interpret this ratio it may be said that the company has 68 cents in cash and near cash to meet every R1 which will require repayment in the short term.
The trend for ABC Company shows:

The acid test ratio has also declined dramatically over the last four years from a high of 2,19 to its current low level of 0,68.
- Unless convinced that liquidity will not be a problem, it would be well advised to take the necessary steps to redress the trend away from liquidity.
Using Leverage Ratios to Analyse the Organisation’s Viability
The leverage ratios examine the financing structure of the organisation. They focus on the combination of owner’s equity and the outside financing (long and short term) used by the company. Three ratios have been selected or this purpose:
- Debt ratio
- Debt to equity ratio
- Interest cover
Note: The 20X4 figures from Document Set 1 are used to illustrate calculation of all the ratios which follow in the rest of the learner guide.
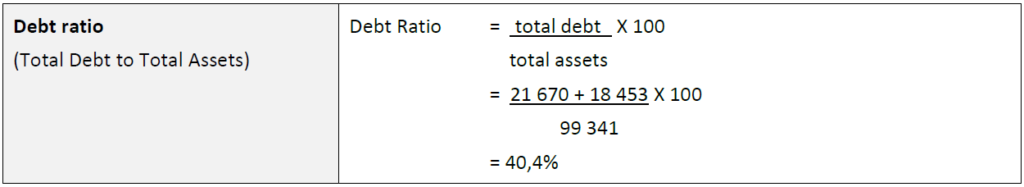
The debt ratio has been defined as total debt compared to tatal assets. The total debt includes long-term loans and current liabilities. The ratio of 40,4% indicates that for every R1 used to purchase total assets, 40,4 cents of the financing was provided by parties other than the ordinary shareholders.
The trend for ABC Company shows:

It is apparent that over the four-year period ABC Company has moved towards a policy of using more debt to finance its assets.
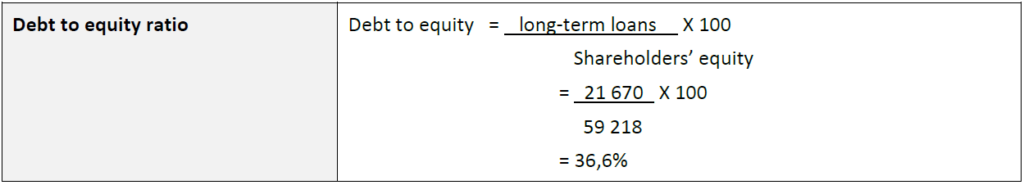
The debt to equity ratio concentrates only on long-term debt, i.e. debt that requires a reward in the form of interest. The comparison is between long-term loans and shareholders’ equity. The ratio may be interpreted to mean that for every R1 of capital provided by ordinary shareholder, 36,6 cents was raised through long-term loans.
The trend for ABC Company shows:

The debt to equity ratio has been a little erratic over the four years, but a definite trend to increasing this ratio is apparent, with the highest percentage of debt to equity over the four years in 20X4.

The interest cover / times interest earned ration shows the number of times which the net profit is able to cover the interest which is due. It is calculated before tax and interest in order to reflect the position most accurately.
The trend for ABC Company shows:

In the difficult year of 20X2, ABC Company’s creditors were most at risk of not receiving their interest as net profit achieved less than three times the required interest expense. Had it not been for investment income, the profit would only just have covered the interest commitment.
DRAFTING BUDGETS AND SUPERVISING FINANCIAL MANAGEMENT
Budgeting is the process of planning financial activities for an upcoming accounting period, usually a year. It requires analysing how a business is currently performing and setting objectives for improving its future financial health. Specific revenue and expense expectations are identified with the intention of increasing a business’s profits while keeping expenses in check.
LINK BUDGET PLANS TO OPERATIONAL OBJECTIVES
In some organisations the preference is for ‘top-down’ budgeting: Budgets are imposed by top managers with little or no consultation with lower-level managers. Most companies however prefer the process of “bottom-up” budgeting: Budgets are prepared by those who must implement them. The budgets are then sent for approval to higher level managers.
In order to strengthen a business’s financial health, budgeting is necessary. Since the financial activities of a business can become quite complex, a budget is needed to outline a plan that managers and employees can follow. Budgeting provides the structure that is required in order to implement effective pricing and spending efforts.
Budgeting offers five main benefits:
- Budgeting facilitates planning – Planning is the main key to budgeting. A business that plans its future financial activities is one that will have a vision for success. Budget planning requires a business to articulate its vision for the future and how it will accomplish it. Strategies are developed and deadlines are identified to accomplish the established budget.
The planning aspect of budgeting also helps a business establish benchmarks that it can use to measure its progress toward achieving its financial objectives. - Budgeting enhances communication – Budgets communicate the spending and sales expectations of the managers and employees within an organisation. Communication is enhanced when the individuals responsible for enforcing and meeting financial expectations can find these guidelines in a budget. Managers and employees know what their boundaries are for the upcoming accounting period and can adjust their spending and sales activities accordingly.
- Budgeting reinforces accountability – Since budgets are communicated to those individuals responsible for implementing them, accountability is reinforced. The responsible managers and employees can be consulted if any deviations from the budget occur. Budgets enable accountable individuals to make wise financial decisions by giving them the information they need.
- Budgeting identifies problems – Budget planning requires a business to identify any financial problems that are developing. Since a budgeted financial statement is broken into months or quarters, deviations from the budget can alert members of management to potential problems. Assigning specific numbers to financial expectations helps draw attention to situations the business needs to investigate.
- Budgeting motivates employees – The clear guidelines that are outlined in a budget provide a method by which managers and employees can be rewarded for their efforts. It is easy to evaluate managers’ and employees’ performance by identifying whether the financial objectives articulated in the budget are met. The compensation that individuals will receive if they meet the financial expectations in the budget will motivate them to adhere to it.
In general, there are three different types of budgets:
- Operating Budget: This is often referred to as the annual budget and shows how much money will be needed over a longer period, such as a year or for the duration of a specific project of programme. Budget amounts are usually divided into major categories, such as salaries, benefits, equipment, office supplies, etc. These major categories can be divided into smaller specific items if needed. The more detailed the categories, the more accurate the budget.
- Cash Budget: shows the amount of cash you expect to receive and pay in the near term, such as a month.
- Capital Budget: shows how much money you have to spend if you want to buy, operate and maintain major pieces of equipment, such as buildings, cars, computers, furniture, etc.
When you are required to create a budget, it is imperative that you understand exactly what you are budgeting for. You need to understand what the company’s vision, strategy and goals are; what the activities are that you need to budget for; and what the overall expectations of the budget is.
ESTABLISH OPERATIONAL OBJECTIVES
Objectives provide the direction you need when establishing a budget. The guidance objectives provide will ensure that your budgeting decisions relate back to promoting the overall financial health of your business. Without objectives, you risk making budgeting decisions that are misguided or simply not as effective as they could be.