
DEMONSTRATE AN UNDERSTANDING OF THE RELATIONSHIP BETWEEN COSTS, REVENUE AND PROFITS.
There are three fundamental relationships in business:
- Revenue varies directly with the number of units sold and the price the sales units are sold at.
- Some costs vary directly with the number of units sold but, some costs in the business are fixed for a period and do not vary directly with sales levels.
- These costs do not automatically increase if sales increase and do not reduce if sales are lower than expected.
This creates a cost volume profit relationship which can be seen by the graph below:
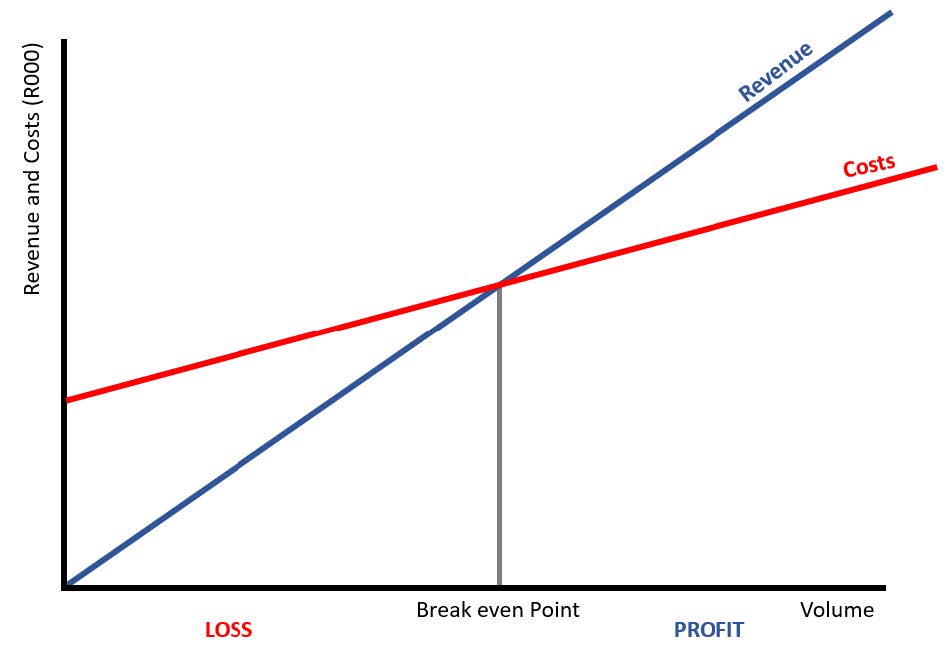
– As you can see the Revenue line starts from zero (if you don’t sell anything, you don’t generate any revenue) while the Cost line starts from a point on the R000 axis which represents the fixed costs of the business.
– Where the Revenue line and the cost line meet, the business does not make a profit or loss and is said to be at the breakeven point.
– To the left of the breakeven point, the business is making a loss because costs are greater than revenue. While the angle of the revenue line is steeper than the cost line, it takes single sales to pay for the fixed costs.
– To the right of the breakeven point, the business is making a profit because revenue is greater than costs.
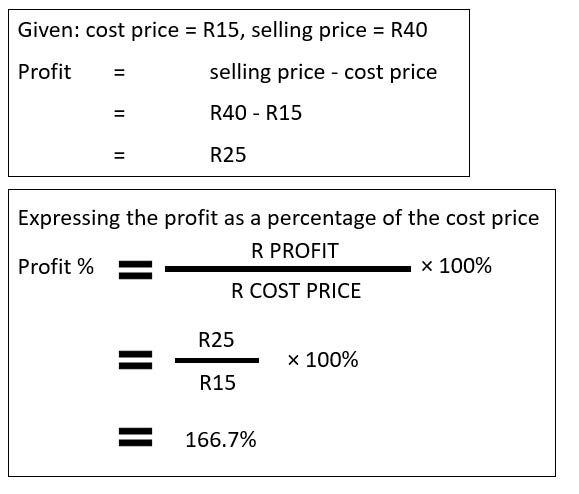
EXAMPLE 1:
PROFIT = REVENUE – COST
A shopkeeper buys scientific calculators in bulk for R15 each. He sells them for R40 each. Calculate the profit on each calculator in Rands, and as a percentage of the cost price.
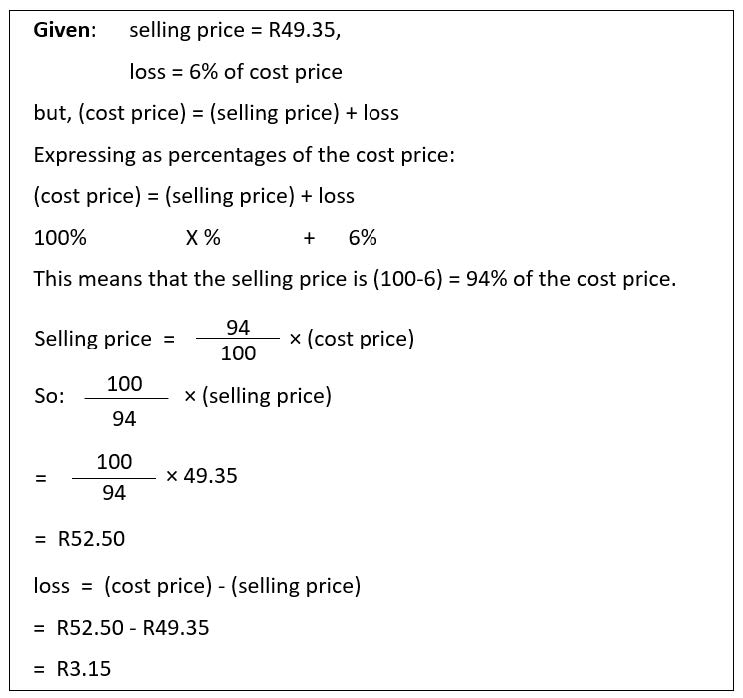
EXAMPLE 2:
A school bookshop sells an outdated biology text book for R49.35, making a 6% loss. What was the cost price of the book, and what is the cash value of the loss?
METHODS OF COSTING
There are a number of methods for calculating costs. For the purpose of this module we shall discuss the following;
- Absorption costing
- Variable costing
A. ABSORPTION COSTING
Absorption costing is a method for accumulating fixed and variable costs associated with the production process and apportioning them to individual products. Thus, a product must absorb a broad range of costs. These costs are not recognized as expenses in the month when an entity pays for them. Instead, they remain in inventory as an asset until such time as the inventory is sold; at that point, they are charged to cost of goods sold.
Product absorption costing follows these steps:
- Identify the cost object;
- Identify the direct costs associated with the cost object;
- Identify the overhead costs;
- Select the cost allocation base to use in assigning overhead costs to the cost object;
- Develop the overhead rate for allocating overhead to the cost object.
- COST OBJECTS: Recall that a cost object is anything that we want to know the cost of, such as a product or service.
- DIRECT COSTS: Management accounting classifies product costs as either direct costs or overhead costs (indirect costs). This distinction is important because costing systems handle these two types of costs very differently. The distinction is sometimes subtle, because whether a cost is direct or overhead is a function of the cost object, and also partly a matter of choice on the part of managers and accountants.
Direct materials: materials that become part of the finished product and that can be conveniently and economically traced to specific units (or batches) or product. Example of direct materials for an apparel manufacturer: fabric. All other materials, such as thread and zippers, are probably indirect.
Direct labour: costs for labour that can be conveniently and economically traced to a unit (or batch) of product. The following examples show how the determination of whether a cost is direct or overhead depends on the identification of the cost object. - OVERHEAD COSTS: Overhead costs are costs that are related to the cost object, but cannot be traced to the cost object in an economically feasible way. Overhead costs are not directly traceable to specific units of production. Examples of overhead costs incurred at an apparel manufacturer, when the cost object is a batch of product, probably include the following:
– Electricity
– Factory office salaries
– Building and machine maintenance
– Factory depreciation
The distinction between direct costs and overhead costs relate, in some measure, to the way the accounting system treats the cost. For example, one apparel manufacturer might track thread using the same methods that are used to track fabric, thus treating thread as a direct material. Another apparel manufacturer might decide that the cost of thread is immaterial, and does not warrant the cost and effort to track it as a direct cost. For this company, thread is an overhead cost. Therefore, whether some costs are direct or overhead depend on a choice made by the manager and the cost accountant.
There are three ways overhead costs can be treated in any decision-making context: (1) they can be ignored, (2) they can be treated as a lump-sum, or (3) they can be allocated to the products and services (i.e., to the cost objects) to which they relate. Each of these three alternatives is appropriate, depending on the circumstances and the purpose for which the accounting is done. However, in this chapter and throughout much of this book, we are concerned with the third alternative: how to allocate overhead costs to products and services. - COST ALLOCATION BASES: The allocation base is the “link” that is used to attach overhead costs to the cost object. In a manufacturing setting, the simplest allocation base is the number of units produced. For example, if the factory makes 15,000 units, the accounting system can simply “spread” the overhead costs evenly over all 15,000 units. The problem with using units as an allocation base, however, is that if the factory makes a range of different products, those products might differ significantly in their resource utilisation. A deluxe widget might require twice as much labour and 20% more materials than a standard widget, and one might infer that the deluxe widget also requires more resources that are represented by overhead costs.
Whatever cost allocation base is chosen, it must be a “common denominator” across all cost objects. For example, a furniture factory could allocate overhead costs across all products using direct labour hours, because direct labour is incurred by all products made at the factory. However, it would not seem appropriate to allocate factory overhead based on the quantity of wood used in each unit, if the factory makes both wood furniture and a line of plastic-moulded, because no overhead would be allocated to the plastic chairs.
I. OVERHEAD RATES: The overhead rate is the ratio of cost pool overhead dollars in the numerator, and the total quantity of the allocation base in the denominator:
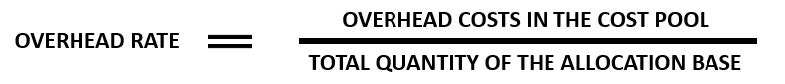
The result represents dollars of overhead per unit of the allocation base. For example, if an apparel factory allocates overhead based on direct labour hours, the overhead rate represents dollars of overhead per direct labour hour. Assume the overhead rate is R20 per direct labour hour. Then for every hour that a sewing operator spends working on product, R20 will be allocated to the products that the sewing operator assembles during that hour.
EXAMPLE
The ZFN Company, a newly formed company based in Cape Town makes jeans and premium khakis. Each product line has its own assembly line on the factory floor. Overhead costs for the factory for 2005 were R3, 300,000. 500,000 jeans and 400,000 khakis were produced during the year. 500,000 direct labour hours were used: 200,000 for jeans, and 300,000 for khakis. The average direct labour wage rate was the same on both assembly lines, and was R14 per hour. Denim fabric is used to make jeans, and khakis are made from a cotton twill fabric. Overhead is allocated using direct labour hours.
The following journal entries and T-accounts illustrate how the accounting system records the manufacturing activities of the factory in order to derive product cost information for jeans and khakis. Journal entry (6) to debit overhead to work-in-process is based on an overhead rate calculated as follows.
R3, 300,000 ÷ 500,000 direct labour hours = R6.60 per direct labour hour.
In practice, the factory would track costs by batch, or perhaps weekly, but to simplify our example, we record only one journal entry for each type of transaction. We also make the unrealistic assumption that there is no work-in-process at the end of the period. To focus the presentation on inventory-related accounts, T-accounts for some non-inventory accounts, and the entry to debit accounts receivable and credit revenue, are omitted.
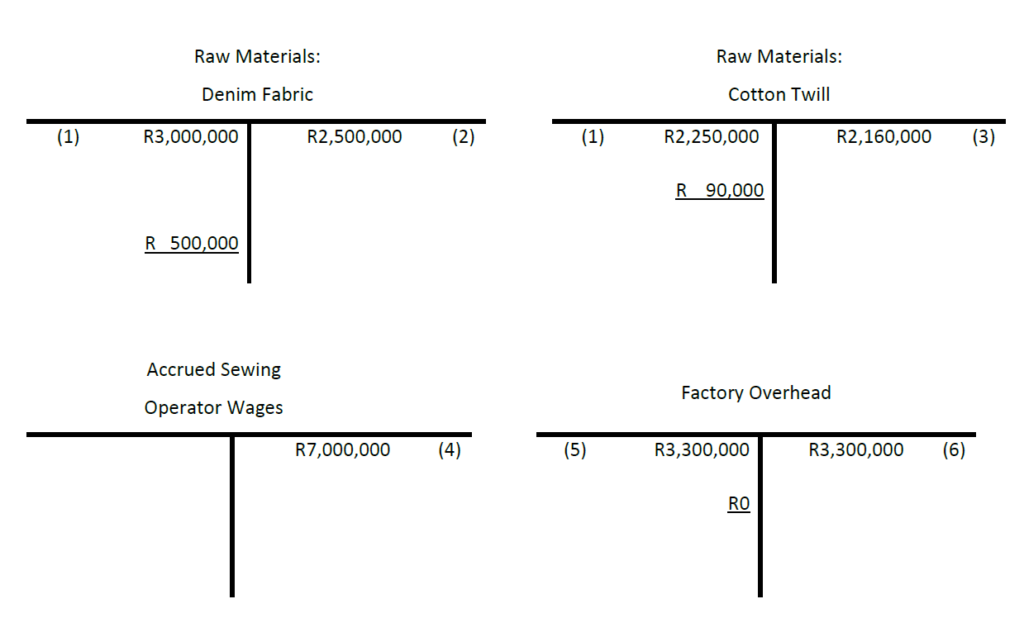
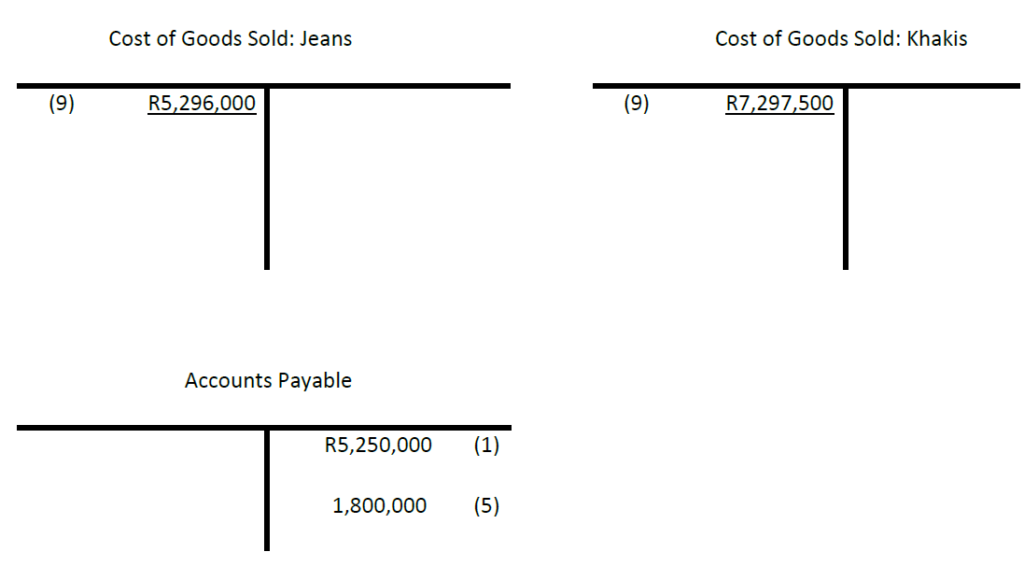
1.
Raw Materials: denim fabric R3, 000,000
Raw Materials: cotton twill R2,250,000
Accounts Payable R5, 250,000
(To record the purchase of 600,000 yards of denim fabric at R5.00 per yard, and 500,000 yards of cotton twill fabric at R4.50 per yard.)
2.
Work-in-process: Jeans R2, 500,000
Raw Materials: denim fabric R2, 500,000
(To record materials requisitions for 500,000 yards, for the movement of denim from the receiving department to the cutting room.)
3.
Work-in-process: Khakis R2, 160,000
Raw Materials: cotton twill R2, 160,000
(To record materials requisitions for 480,000 yards, for the movement of cotton twill from the receiving department to the cutting room.)
4.
Work-in-process: Jeans R2, 800,000
Work-in-process: Khakis R4,200,000
Accrued Sewing Operator Wage R7, 000,000
(To record sewing operator wages for the year: 200,000 hours for jeans, and 300,000 hours for khakis, at R14 per hour.)
5.
Factory Overhead R3, 300,000
Accounts Payable R1, 800,000
Accrued Wages for Indirect Labour R900,000
Accumulated Depreciation R600,000
(To record overhead costs incurred during the year, including utilities, depreciation, repairs and maintenance, and indirect wages and salaries.)
6.
Work-in-process: JeansR1,320,000
Work-in-process: Khakis R1,980,000
Factory Overhead R3, 300,000
(To allocate factory overhead to production, using an overhead rate of R6.60 per direct labour hour.)
7.
Finished Goods: Jeans R6, 620,000
Work-in-process: Jeans R6, 620,000
(To record the completion of all 500,000 jeans, at R13.24 per pair.)
8.
Finished Goods: Khakis R8, 340,000
Work-in-process: Khakis R8, 340,000
(To record the completion of all 400,000 khakis, at R20.85 per pair.)
9.
Cost of Goods Sold: Jeans R5, 296,000
Cost of Goods Sold: Khakis R7, 297,500
Finished Goods: Jeans R5, 296,000
Finished Goods: Khakis R7, 297,500
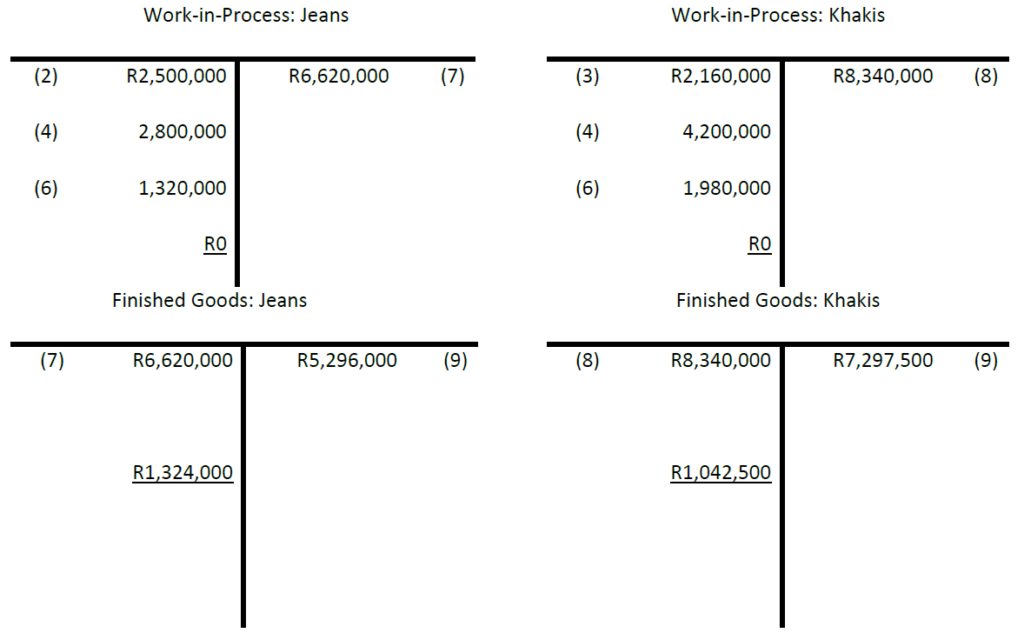
The per-unit inventory cost is calculated as follows:
Jeans: R6, 620,000 ÷ 500,000 pairs = R13.24 per pair
Khakis: R8, 340,000 ÷ 400,000 pairs = R20.85 per pair
These amounts, which are used in journal entry (9), can be detailed as follows:
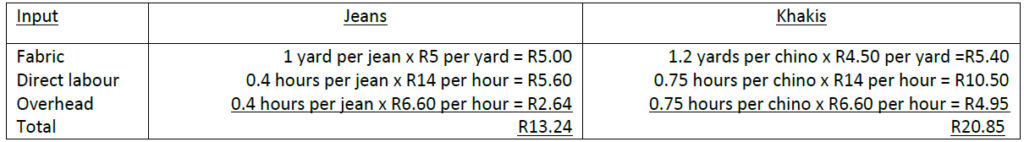
In the above table, the direct labour hours per jean and per chino appear in the lines for both the per-unit direct labour cost and the per-unit overhead cost, because overhead is allocated based on direct labour hours. If the allocation base had been something else, such as machine hours, the hours per unit would only appear in the calculation of the direct labour cost.
More overhead is allocated to each pair of khakis than to each pair of pants (R4.95 versus R2.64) because direct labour hours has been chosen as the allocation base, and each chino requires more direct labour time than each pair of jeans (0.75 hours versus 0.40 hours). Changing the allocation base cannot change the total amount of overhead incurred, but it will usually shift costs from some products to others. For example, if the allocation base were units of production instead of direct labour hours, the overhead rate would be:
R3, 300,000 ÷ 900,000 units = R3.67 per unit.
In this case, the total cost per pair of jeans would increase from R13.24 to R14.27, and the total cost per pair of khakis would decrease from R20.85 to R19.57.
B. VARIABLE COSTING
Variable costing is a costing system under which those costs of production that vary with output are treated as product costs. This would usually include direct materials, direct labour and variable portion of manufacturing overhead. Fixed manufacturing cost is not treated as a product costs under variable costing. Rather, fixed manufacturing cost is treated as a period cost and, like selling and administrative expenses, it is charged off in its entirety against revenue each period. Consequently, the cost of a unit of product in inventory or cost of goods sold under this method does not contain any fixed overhead cost. Variable costing is some time referred to as direct costing or marginal costing.
The main features of marginal costing are as follows:
- Cost classification
- Stock/inventory valuation
- Marginal contribution
- COST CLASSIFICATION
The marginal costing technique makes a sharp distinction between variable costs and fixed costs. It is the variable cost on the basis of which production and sales policies are designed by a firm following the marginal costing technique. - STOCK/INVENTORY VALUATION
Under marginal costing, inventory/stock for profit measurement is valued at marginal cost. It is in sharp contrast to the total unit cost under absorption costing method. - MARGINAL CONTRIBUTION
Marginal costing technique makes use of marginal contribution for marking various decisions. Marginal contribution is the difference between sales and marginal cost. It forms the basis for judging the profitability of different products or departments.
Contribution = Sales revenue per unit – Variable cost per unit
As long as a product generates positive contribution, it may be continued. Contribution accounting looks at the contribution generated
EXAMPLE
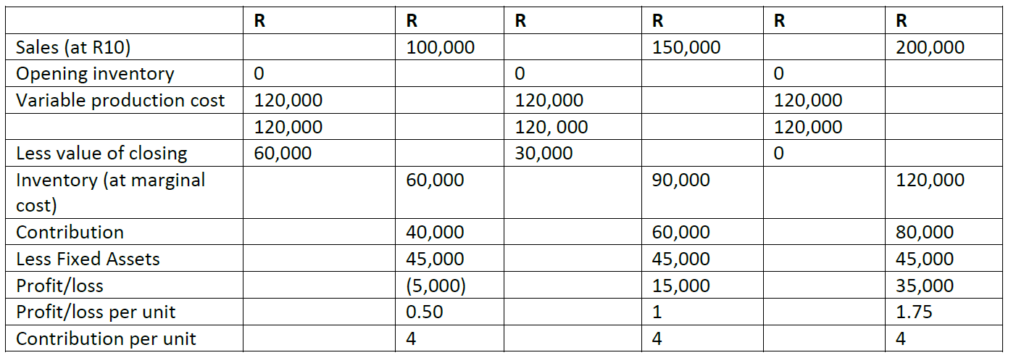
Walter and Sons makes a product, the Splash, which has a variable production cost of R6 per unit and a sales price of R10 per unit. At the beginning of September 20X0, there were no opening inventories and production during the month was 20,000 units. Fixed costs for the month were R30, 000 for production and R15, 000 for administration, sales and distribution. There were no variable marketing costs.
Required
Calculate the contribution and profit for September, using marginal costing principles, if sales were as follows.
(a) 10,000 Splashes
(b) 15,000 Splashes
(c) 20,000 Splashes
SOLUTION
The first stage in the profit calculation must be to identify the variable costs, and then the contribution. Fixed costs are deducted from the total contribution to derive the profit. All closing inventories are valued at marginal production cost (R6 per unit). Production during the month in all three cases is 20,000 units
TYPES OF PROFIT
- GROSS PROFIT
This is the difference between sales income and the direct costs of making those products. Gross profit is used as a performance indicator to help the business make decisions over its pricing policies and use of materials.
The Gross Profit Margin illustrates the profit a company makes after paying off its Cost of Goods sold (cost of inventory). Gross Profit Margin illustrates to us how efficient the management is in using its labour and raw materials in the process of production. The formula for Gross Profit Margin is:
Gross Profit Margin = (Sales – Cost of Goods Sold) / Sales
For example, imagine a company with Gross Sales for 2006 equalling R5 million. The cost of goods sold amounts to R1.2 million. What is the Gross Profit Margin?
Gross Profit Margin = (5,000,000 – 1,200,000) / 5,000,000 Gross Profit Margin = 3,800,000 / 5,000,000 Gross Profit Margin = 76% - OPERATING PROFIT MARGIN
The Operating Profit Margin will illustrate to you how efficiently the managers of a firm are using business operations to generate profit. This ratio also shows the success rate of these managers. The formula for Operating Profit Margin is:
Operating Profit Margin = Earnings before Interest & Taxes / Sales
For example, consider a firm that has R2 million sales this year and an EBIT (Earnings before Interest & Taxes) of R450,000. What is the Operating Profit Margin?
Operating Profit Margin = 450,000 / 2,000,000 Operating Profit Margin = 22.5%
The higher the Operating Profit Margin, the better. This is because a higher Operating Profit Margin shows the company can keep its costs under control (successful cost accounting). A higher Operating Profit Margin can also mean sales are increasing faster than costs, and the firm is in a relatively liquid position. The difference between Gross Profit Margin and Operating Profit Margin is that the gross profit margin accounts for only Cost of Goods sold, but the Operating Profit Margin accounts for both Cost of Goods sold and Administration/Selling expenses. - NET PROFIT
Net profit represents gross profit less all expenses associated with the normal running of the business. Net profit shows how well the business performs under its normal trading circumstances. It is used to calculate the “primary efficiency” ratio.
Net Profit Margin tells you exactly how the managers and operations of a business are performing. Net Profit Margin compares the net income of a firm with total sales achieved
The formula for Net Profit Margin is:
Net Profit Margin = Net Income / Sales
For example, consider a firm that has an annual net income of R500,000 while the total sales achieved during the year amount to R2,200,000. What’s the Net Profit Margin?
Net Profit Margin = 500,000 / 2,200,000 Net Profit Margin = 22.7%
Once you calculate the net profit margin of a firm, compare it with industry standards. For example, typical software companies have a Gross Margin of 90% (as mentioned above).
However, the NET profit margin is only 27%. That’s a huge difference right there and it tells us that the marketing/administration costs of software companies is huge!
However, this also tells us that operating costs and cost of goods sold of software companies is relatively low. - NET PROFIT AFTER INTEREST AND TAXATION
This is the profit available for the shareholders. Net profit after interest and taxation is all due to the owners of the business. They can choose to take out, in the form of dividends, all, some or none of this. - RETAINED PROFIT
Retained profit is the profit left over after the shareholders have been paid their dividends. Retained profit is normally reinvested in the business. This is the profit that is left over after a firm pays off dividends to its shareholders. EXAMPLES:
Microsoft has retained R18.9 billion in earning over the years. It has over 2.5 times that amount in stockholder equity (R47.29 billion), no debt, and earned over 12.57% on its equity last year. Obviously, the company is using the shareholder’s money very effectively. With a market cap of R314 billion, the software giant has done an amazing job.
Lear Corporation is a company that creates automotive interiors and electrical components for everyone from General Motors to BWM. As of 2001, the company had retained over R1 billion in earnings and had a negative tangible asset value of R1.67 billion dollars! It had a return on equity of 2.16%, which is less than a passbook savings account. The company is astronomically priced at 79.01 times earnings and has a market cap of R2.67 billion. In other words: Shareholders have reinvested a billion dollars of their money back into the company and what have they gotten? They owe R1.67 billion. That is a bad investment.