
Appropriate methods are selected for collecting, recording and organising financial and/economic data.
SELECT METHODS FOR WORKING WITH FINANCIAL AND ECONOMIC DATA
Financial data are defined as follows: “a full fiscal year’s data on a company’s performance in terms of profits, revenues, operating income, etc. when accompanied by discussion of significant events that have affected performance”.
Financial data include, but are not limited to, the documentation of the charges for services, costs of providing services, revenues generated from services and revenues from other sources.
The primary goal of financial data analysis is to maximise the wealth of the shareholders and the overall profitability of the company. Financial managers maximise the wealth of the shareholders by applying such concepts as credit and inventory management.
Economic data are usually numerical time-series, i.e., sets of data (covering periods of time) for part or all of a single economy or the international economy. When they are time-series the data sets are usually monthly but can be quarterly and annual. The data may be adjusted in various ways (for ease of further analysis), most commonly adjusted or unadjusted for seasonal fluctuations.
Economic data may also describe functions or inter-relationships between variables [where the inter-relationships may be theoretical (e.g. a production function) rather than factual], and they may describe a static as opposed to a dynamic relationship (e.g., an input-output matrix as opposed to a series showing changes of automobile output over time).
Thousands of data sets are available. At the level of an economy, these are compiled by use of national accounts. Such data include the major components of Gross National Product, Gross National Expenditure, Gross National
Income, and a whole range of series including output, orders, trade, confidence, prices and financial series (e.g., money and interest rates). At the international level there are many series including international trade, international financial flows, direct investment flows (between countries) and exchange rates.
Within a country the data series are usually produced by one or more statistical organisations, e.g., a government or quasi-government organisation and/or the central bank. International statistics are produced by several international bodies and firms, including the International Monetary Fund and the Bank for International Settlements.
Demographic Data1
Demographic data are the characteristics of a human population as used in government, marketing or opinion research, or the demographic profiles used in such research. Commonly used demographics include sex, race, age, income, disabilities, mobility (in terms of travel time to work or number of vehicles available), educational attainment, home ownership, employment status, and even location. Distributions of values within a demographic variable, and across households, are both of interest, as well as trends over time. Demographics are frequently used in economic and marketing research.
Demographic trends describe the changes in demographics in a population over time. For example, the average age of a population may increase over time. It may decrease as well. Certain restrictions may be set in place changing those numbers, e.g. in China with the one child policy.
Methods for Collecting Data
There are two types of data:
– Primary data
– Secondary data
When obtaining mathematical information, the investigator must take care to use science and technology effectively and critically, showing responsibility to the environment and health of others.
Primary data are data collected directly by the investigator or by the organisation employing the investigator.
Primary data are collected by a variety of methods:
– Observation
– Personal interview
– Check sheets
– Electronic data capture
– Experiments simulated on a computer
– Controlled laboratory or field experiments.
Secondary data are collected by someone else and are available in published sources; for example, quarterly profits published in the Finance Week are secondary data.
Literature study – This is a source of secondary data from which information may be gleaned. To access this form of secondary data we need to read published books, articles and other literature by experts on our subject.
Example of secondary data:
Economic and financial indicators
From The Economist print edition
Inflation in America fell by a fifth of a percentage point to 2% in May. On a seasonally adjusted basis, prices fell by 0.2% from a month earlier. On June 23rd the Federal Reserve voted to keep interest rates unchanged, remarking that underlying inflation had trended lower in recent months.
The number of new houses sold in America during the month of May fell by nearly a third from a month earlier, to an annual pace of 300,000, 18.3% lower than the corresponding rate a year earlier.
America’s current-account deficit for the 12 months to the end of the first quarter widened to $391.9 billion from $378.4 billion for the year to the previous quarter.
Inflation in Canada eased to 1.4% in May from 1.8% in April. Excluding energy prices, inflation slowed by a tenth of a percentage point to 1.0% last month.
The euro area’s current-account deficit shrank to $48.9 billion in the 12 months to the end of April from $52.6 billion in the year to the previous month.
Industrial output in Taiwan surged by 30.7% in the year to the end of May.
Inflation in Malaysia edged up by a tenth of a percentage point to 1.6% in May. Prices rose by 0.3% from the month earlier, the first month-on-month increase since January.
Hong Kong’s inflation rate rose by 0.1 percentage points to 2.5% in May.
From: http://www.economist.com/markets/indicators/
Check sheets
A check sheet / checklist is structured and the questions are closed.
Advantages of checklists are that:
– They are easy and convenient to answer;
– The responses are easy to measure;
– The data can be processed in a uniform way.
The respondents can only choose which answer best describes them and because the respondent is offered little choice the researcher only needs to count up how many respondents agreed with a specific response.
Disadvantages of checklists are that:
– The respondent may be irritated by not being able to find his or her preferred answer among the given alternatives.
– The checklist may produce results that lack accuracy because the questions are answered at a very superficial level. The respondents may want to qualify or explain their responses but not have the opportunity to do so.
This problem may especially be faced by a respondent presented with a situation (or, incident) who is then asked to check which attitude he most identifies with, with regard to the incident. The checklist is not always the most practical method of gauging the opinions and beliefs of the respondent.
An example of a checklist:
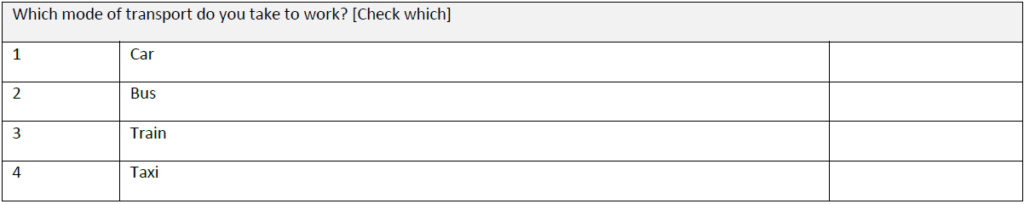
If a researcher has made provision for all possible alternative answers to each question, and if the respondent need merely tick the answer that applies, the questionnaire is called a checklist.
Observation
To find out how much of a thing exists, or to find out what the result is of combining one ingredient with another, the best thing to do is to look. Often, looking at the condition of the subject or at the results of an experiment can yield a satisfactory answer. This is called observation.
Observation is the most obvious form of primary data collection. If you want to know the product yield in a chemical reaction, observe the reaction and measure the results. This is a very effective method of data collection.
Example
How many cars enter the Canal Walk parking garage at entrance 5 on an average weekday morning between 5am and 7 am?
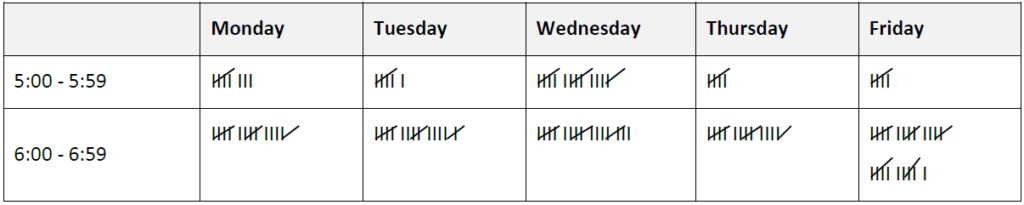
This table is an example of a tally sheet. A tally sheet is useful if we want to know how much of a certain thing exists or is present.
Questionnaires
Market researchers and others use questionnaires to aid them in their research. A questionnaire is a sheet containing questions. A respondent needs to answer the questions.
First, the mode of data collection must be decided upon (e.g., mail, telephone, or in person). Once this has been determined a questionnaire can then be developed and pre-tested.
Planning the questionnaire is one of the most critical stages in the survey development process. Social and behavioural scientists have given a great deal of thought to the design issues involved.
Questionnaire construction has elements that often appear to be just plain common sense, but, when they are implemented, may involve some subtlety. It is common sense to require that the concepts be clearly defined and questions unambiguously phrased; otherwise, the resulting data are apt to be seriously misleading.
Consider how we might apply this strategy in a survey to estimate the incidence of robbery victimisation. One might start out by simply asking, “Were you robbed during the last six months?” Although apparently straightforward and clear-cut, the question does present an ambiguous stimulus. Many respondents are unaware of the legal distinction between robbery (involving personal confrontation of the victim by the offender) and burglary (involving breaking and entering but no confrontation).
Therefore, in such a survey, the questions on robbery victimisation would not mention “robbery.” Instead, there are several questions used; when taken together, they seek to capture the desired responses by using more universally understood phrases.
Example from the national crime victim survey questionnaire:
I’m going to read some examples that will give you an idea of the kinds of crimes this study covers.
As I go through them, tell me if any of these happened to you in the last 6 months, that is since , 201_.
Was something belonging to YOU stolen, such as-
a. Things that you carry, like luggage, a wallet, purse, briefcase, book-
b. Clothing, jewellery, or calculator-
c. Bicycle or sports equipment-
d. Things in your home-like a TV, stereo, or tools-
e. Things from a vehicle, such as a package, groceries, camera, cassette tapes- OR
f. Did anyone ATTEMPT to steal anything belonging to you?
Briefly describe incident(s)
Designing a suitable questionnaire entails more than well-defined concepts and distinct phraseology. Attention must also be given to its length. Long questionnaires are apt to induce respondent fatigue and errors arising from inattention, refusals, and incomplete answers. They may also contribute to higher non-response rates in subsequent surveys involving the same respondents.
There are other factors to take into account when planning a questionnaire. These include such diverse considerations as: the order in which the questions are asked. their appearance, even such things as the questionnaire’s physical size and format.
Respondents are more likely to cooperate if the questions are simple, clear, easy to answer, and personally relevant to them. It is recommended that questionnaires be written at the 9th-grade (standard 7) reading level.
When you think you’ve finished the individual questions, step back and look at the questionnaire as a whole. Remember, the questionnaire is a total package and needs to be considered as such:
– It needs a strong introduction conveying to the respondent what the survey is about
– It should indicate why the questions are being asked
– It needs interesting and readily answerable questions at the beginning to gain respondent attention and build rapport
– The conclusion should be gentle and friendly, expressing gratitude for the respondent’s time and effort
The questions need to flow well from one to the next, and designers should be aware that earlier questions provide information and context to the respondents that they may use in later answers. Often the answer to one question may influence the answer to a later question. For instance, suppose respondents are asked first, “How do you feel about your job?” and later on “How do you feel about life in general?”
Answers to the second question may be tempered by the first question. Because respondents have already reported their feelings about their job, including those feelings in the second answer may be redundant.
On the other hand, if their job is very important to them, then the answer to the first question may be used when constructing the second answer. These so-called “order effects” are difficult to predict and often become apparent only through pre-tests of the questionnaire, in which different orderings of the questions are compared.
Interviews
In the interview, the researcher talks to the respondent and obtains information directly. This can be advantageous because it is flexible and in-depth. When a respondent speaks, the interviewer is able to redirect the questioning to deal with the unexpected. The researcher can ascertain why the respondent answers a certain way. People will more readily answer questions in an interview than they will in a questionnaire.
Interviewing is sometimes difficult because it costs a great deal in time and money. It can reach out to far fewer respondents than the questionnaire. It takes a great deal of experience and expertise on the part of the interviewer to prepare an interview schedule (the list of questions to be asked) and to ask questions in a way that allows valid conclusions to be drawn from the responses.
Surveys
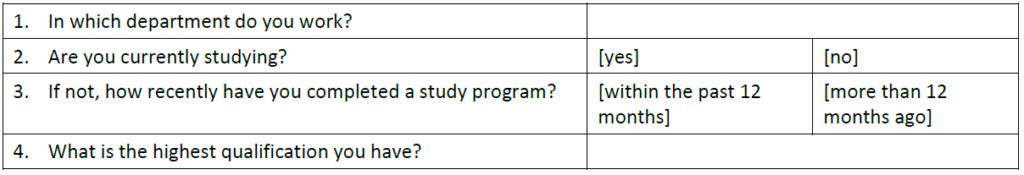
These are very simple questionnaires which require very little from the respondent. An example in the arena of workplace training may require the respondent to tick the appropriate box in answering the following questions:
Example
Shortcuts to avoid when conducting a survey
Conducting a credible survey entails scores of activities, each of which must be carefully planned and controlled. Taking shortcuts can invalidate the results and badly mislead the users of the information gathered.
Here are three shortcuts to avoid:
- Not pre-testing procedures
- Not sufficiently following up on non-respondents
- Sloppy work and inadequate quality controls
A pre-test of the questionnaire and procedures is the only way of finding out if everything “works”- especially if a survey employs new techniques or a new set of questions. Because it is rarely possible to foresee all the potential misunderstandings or biasing effects of different questions and procedures, it is vital for a well-designed survey operation to include provision for a pre-test. There should usually be a series of small-scale pilot studies to test the feasibility of the individual techniques (if new) or to perfect the questionnaire concepts and wording.
This should be followed by a full-scale “dress rehearsal” to find out if everything connects together as intended.
Failure to follow up non-respondents can ruin an otherwise well-designed survey. It is not uncommon for the initial response rate in many surveys to be under 50 percent.
Sloppy execution of a survey can seriously damage results. Without proper checking, errors may go undetected. With good procedures, on the other hand, they might even have been prevented.
Difficulties may arise at any point during these basic steps of the survey process:
Organisation – The survey taker determines who is to be sampled and what is to be learned about the sample
- Questionnaire design – Based on the goal of the survey, questions for survey respondents are prepared and arranged in a logical order to create the survey questionnaire
- Sampling – A repeatable plan is developed to randomly choose a sample capable of meeting the survey’s goals. Then a sample is selected
- Data collection – A plan for contacting the sample and collecting information from participants is developed and carried out
- Data processing – Collected data are entered into the computer and checked for accuracy
- Analysis – The results of the survey are compiled and disseminated
A final problem that can be encountered during surveys is “Interviewer bias” , which can easily arise in highly-charged emotive or political inquiries, for example, when the interviewer misunderstands a reply, marks a wrong code on the answer sheet, or even interprets an answer incorrectly as a result of his/her own view on the topic.
Replies can also be biased through forgetfulness on the part of the people interviewed, by the desire to make a good impression on the interviewer, or by the fear that a truthful answer may result in something to their disadvantage. In such cases, it may be better to leave a form or questionnaire to be filled in and collected later.