
MODULE 2 – PART 2: Analyse the interaction of demand and supply in price determination
INTRODUCTION
Supply and demand is perhaps one of the most fundamental concepts of economics and it is the backbone of a market economy. Demand refers to how much (quantity) of a product or service is desired by buyers. The quantity demanded is the amount of a product people are willing to buy at a certain price; the relationship between price and quantity demanded is known as the demand
relationship. Supply represents how much the market can offer. The quantity supplied refers to the amount of a certain good producers are willing to supply when receiving a certain price. The correlation between price and how much of a good or service is supplied to the market is known as the supply relationship. Price, therefore, is a reflection of supply and demand.
LAWS OF SUPPLY AND DEMAND
Supply and demand is the most useful model for a competitive market, and shows how buyers (citizens) and sellers (businesses) interact in that market.
THE LAW OF DEMAD
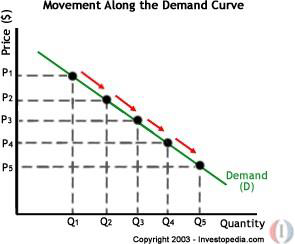
The law of demand states that, if all other factors remain equal, the higher the price of a good, the less people will demand that good. In other words, the higher the price, the lower the quantity demanded. The amount of a good that buyers purchase at a higher price is less because as the price of a good goes up, so does the opportunity cost of buying that good. As a result, people will naturally avoid buying a product that will force them to forgo the consumption of something else they value more. Diagram below shows that the curve is a downward slope.
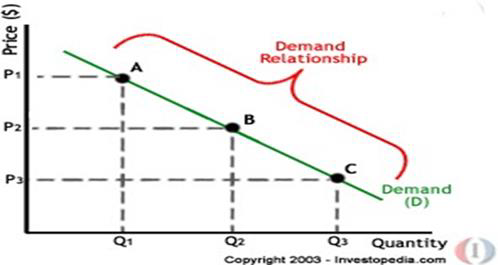
A, B and C are points on the demand curve. Each point on the curve reflects a direct correlation between quantity demanded (Q) and price (P). So, at point A, the quantity demanded will be Q1 and the price will be P1, and so on. The demand relationship curve illustrates the negative relationship between price and quantity demanded. The higher the price of a good the lower the quantity demanded (A), and the lower the price, the more the good will be in demand (C).
THE LAW OF SUPPLY
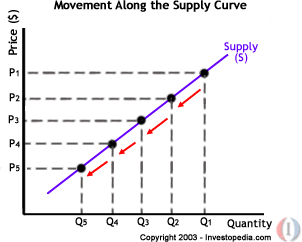
Like the law of demand, the law of supply demonstrates the quantities that will be sold at a certain price. But unlike the law of demand, the supply relationship shows an upward slope. This means that the
higher the price, the higher the quantity supplied. Producers supply more at a higher price because selling a higher quantity at higher price increases revenue.
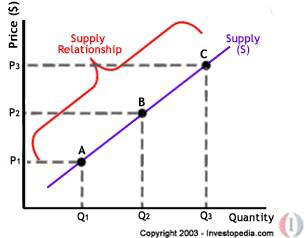
A, B and C are points on the supply curve. Each point on the curve reflects a direct correlation between quantity supplied (Q) and price (P). At point B, the quantity supplied will be Q2 and the price will be P2, and so on.
In order for new ventures to succeed, they should understand the laws of supply and demand.
▪
New ventures should supply the right products and the right time and at the right price.
▪
If a new venture sells inferior products to consumers; they will not buy the products. On the other hand, if the goods or services are of high quality but expensive, consumers will still not buy.
▪
The perfectly competitive markets are very competitive; consumers can buy similar goods or substitutes from many producers or sellers.
▪
Failure to understand the laws of supply and demand is one of the major reasons why many new ventures fail.
SUPPLY AND DEMAND RELATIONSHIP
The price level of a good essentially is determined by the point at which quantity supplied equals quantity demanded. To illustrate, consider the diagram below where supply and demand curves are plotted on the same diagram.
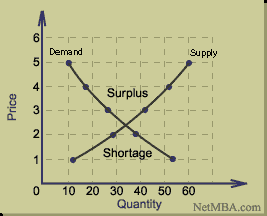
On this graph, there is only one price level at which quantity demanded is in balance with the quantity supplied (equilibrium), and that price is the point at which the supply and the demand curves cross. The law of supply and demand predicts that the price level will move toward the point that equalizes quantities supplied and demanded. To understand why this must be the equilibrium point, consider the situation in which the price is higher than the price at which the curves cross. In such a case, the quantity supplied would be greater than the quantity demanded and there would be a surplus of the good on the market.
From the graph we see that id the unit price is R3 (assuming relative prices in Rand’s) the quantities supplied and demanded would be:
Quantity supplied = 42 units Quantity demanded = 26 units
Therefore, there would be a surplus of 42 – 26 = 16 units. The seller would lower their price in order to sell the surplus.
Suppose the sellers lowered their prices below the equilibrium point. In this case, the quantity demanded would increase beyond what is supplied, and there would be a shortage. If the price is held at R2, the quantity supplied then would be:
Quantity supplied = 28 units Quantity demanded = 38 units
Therefore, there would be a shortage of 38 – 28 units = 10 units. The sellers would increase their prices to earn more money.
The equilibrium point must be the point at which quantity supplied and quantity demanded are in balance, which is where the supply and demand curves cross. From the diagram above, this is at a price of approximately R2, 40 and quantity of 34 units.
Now that we know the laws of supply and demand, let us turn to an example to show how supply and demand affect price.
EXAMPLE 1
Imagine that a special edition CD of your favourite band is released by a local entrepreneur for R50. Because the record company’s previous analysis showed that consumers will not demand CDs at a price higher than R50, only ten CDs were released because the opportunity cost is too high for suppliers to produce more.
If, however, the ten CDs are demanded by 20 people, the price will subsequently rise because, according to the demand relationship, as demand increases, so does the price. Consequently, the rise in price should prompt more CDs to be supplied as the supply relationship shows that the higher the price, the higher the quantity supplied.
If, however, there are 30 CDs produced and demand is still at 20, the price will not be pushed up because the supply more than accommodates demand. In fact after the 20 consumers have been satisfied with their CD purchases, the price of the leftover CDs may drop as CD producers attempt to sell the remaining ten CDs. The lower price will then make the CD more available to people who had previously decided that the opportunity cost of buying the CD at R50 was too high.
EXAMPLE 2
Pretend that you are a supplier
▪
Let’s say that you own a farm and you sell apples along with other fruits. One day, you sell your apples at the farmer’s market for fifty cents per apple and sell out. The next day you sell your apples for a 1 rand a piece and you run out of apples again.
▪
Now you are making twice as much revenue from apples. Since you know you can sell apples for a rand a piece, will you bring more or less apples to the market? Will you plant more or less apples next year?
▪
When the price of a good rises, the supply for that good increases and when the price of a good falls, the supply for that good decreases. This is the law of supply.
EXAMPLE 3
Picture yourself at a market with three apple stands in front of you.
Also assume that all of the apples look exactly the same as far as you can tell.
Two of the apple stands are selling them for sixty cents an apple and one of the apple stands is selling them for fifty cents an apple. How much will you pay for an apple?
Perfect price information and equivalency of goods are some principles of perfect competition.
EXAMPLE 4
Now let’s assume that at a price of ninety cents apiece, suppliers bring 100 apples to the market and consumers are willing to buy 110 apples.
There are ten people who want apples and do not have them. This is called a shortage. If the seller wants to make a greater profit, he will bring more apples to the market or sell the apples for higher price the next day.
These options are also called market corrections.
EXAMPLE 5
Let’s assume that at a price of one rand a piece, suppliers bring 100 apples to the market and consumers are willing to buy 90 apples at that price.
There is a surplus of ten apples. The only way to sell these surplus apples is to lower the price or perhaps give them away.
Next time you come to the market, you may sell your apples at a discounted price to increase the demand and eliminate the surplus. Another solution would be to bring less apples to the market next time or plant less apples in the future.
Both of these options are called market corrections. SHIFTS VERSUS MOVEMENT
For economics, the “movements” and “shifts” in relation to the supply and demand curves represent very different market phenomena:
Movements
A movement refers to a change along a curve. On the demand curve, a movement denotes a change in both price and quantity demanded from one point to another on the curve. The movement implies that the demand relationship remains consistent.
Therefore, a movement along the demand curve will occur when the price of the good changes and the quantity demanded changes in accordance to the original demand relationship. In other words, a movement occurs when a change in the quantity demanded is caused only by a change in price, and vice versa.
MOVEMENT ALONG THE DEMAND CURVE
Like a movement along the demand curve, a movement along the supply curve means that the supply relationship remains consistent. Therefore, a movement along the supply curve will occur when the price of the good changes and the quantity supplied changes in accordance to the original supply relationship. In other words, a movement occurs when a change in quantity supplied is caused only by a change in price, and vice versa.
MOVEMENT ALONG THE SUPPLY CURVE
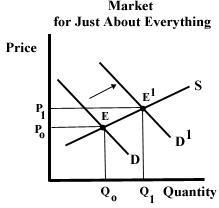
Shifts
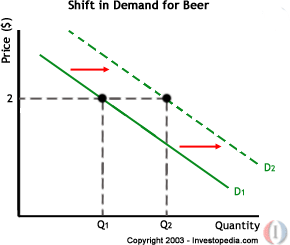
A shift in a demand or supply curve occurs when a good’s quantity demanded or supplied changes even though price remains the same. For instance, if the price for a bottle of beer was R2 and the quantity of beer demanded increased from Q1 to Q2, then there would be a shift in the demand for beer. Shifts in the demand curve imply that the original demand relationship has changed, meaning that quantity demand is affected by a factor other than price. A shift in the demand relationship would occur if, for instance,
beer suddenly became the only type of alcohol available for consumption.
SHIFT IN DEMAND FOR BEER
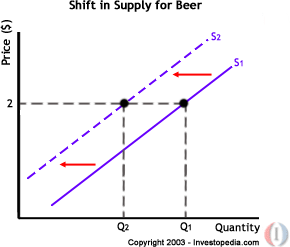
Conversely, if the price for a bottle of beer was R2 and the quantity supplied decreased from Q1 to Q2, then there would be a shift in the supply of beer. Like a shift in the demand curve, a shift in the supply curve implies that the original supply curve has changed, meaning that the quantity supplied is affected by a factor other than price. A shift in the supply curve would occur if, for instance, a natural disaster caused a mass shortage of hops; beer manufacturers would be forced to supply less beer for the same price.
SHIFT IN SUPPLY FOR BEER
REFLECTION

Pricing
The forces of supply and demand intersect to generate a price for a product or service. If the supply is less than the demand, vendors will make a product more expensive. As the price goes up, a certain number of people will decide that the product is becoming too expensive, so demand will go down. Eventually there will be an equalization point where
the supply is exactly equal to the current demand and the price will stabilize.
Ceilings
Sometimes governments or companies may place artificially low ceilings on price for various reasons. When this happens, demand will exceed supply, and eventually a product shortage will develop.
Effects on Behavior
When there is a shortage of supply, the price of a product will usually go up, and businesses often respond by producing more of the product if they can. Eventually this will cause the price to go down, and businesses will respond by producing less. Over time, this can cause a constant fluctuation in price.
Does supply and demand influence the price structure of goods and services offered by your organization?
FACTORS THAT EFFECT SUPPLY AND DEMAND
There are many factors that affect the supply and demand of goods and services.
FACTORS THAT AFFECT DEMAND
If price only changes, the demand curve for a good or service will not shift. Instead, there will be a movement along the demand curve. If price rises, demand will contract; less will be purchased in a given period of time. If price falls, demand will expand, and more will be bought in a given period of time. This is explained in diagram
The demand curve will shift to the left or right, if other factors, other from price, change. What are these factors? There are many, but some includes:
Changes in income. An increase in household income will see demand increasing (a shift of the curve to the right). Usually, this is associated with an increase in the price of the good or service being consumed.
Changes in the prices of substitutes. If the price of a substitute falls, then demand for the good or service will also fall or contract.
Changes in the prices of complements. If the price of a complement rises, then the demand for the good or service will fall (or ”contract”).
Changes in the size and age distribution of the general population. As South Africa’s population is rapidly aging (as a result of smaller numbers of children per family), demand for many goods and services demanded by older people has risen.
Changes in interest rates and the general availability of credit. Many households finance consumption through borrowing. If interest rates rise, demand contracts for many goods and services;
particularly housing.
Advertising and changes in fashion can have a market effect on demand. Indeed, producers of goods that are close substitutes generally spend large amounts on advertising, reminding consumers that their product is ”better” than the opposition’s product.
Seasonal changes. For example, demand for ice creams rises in warmer weather, and falls in the colder months of the year.
Changes in technology. Firms are constantly attempting to gain greater sales through improvements in the quality and features of their product. This is seen clearly in the computer market. The introduction of a new personal computer with a bigger memory chip or a faster operating speed soon results in prices of older model computers rapidly falling.
Consumer expectations also affect demand. People tend to maintain high levels of consumption when they feel confident about their continuing employment in the future. If people, for whatever reason, feel less confident about the future, they tend to decrease consumption and increase saving. If households believe that inflation will rise in the future, or that government taxes will rise, they will increase their demand for many goods and services, to ”beat” the price rise.
FACTORS THAT AFFECT SUPPLY
Factors that affect the supply for goods and services include:
▪
Changes in the Price of a good or service
▪
Changes in Technology (or the State of the Art) of business firms
▪
Changes in the Tastes/Preferences of consumers for goods/services
▪
Changes in consumers’ Income spent on goods and services
▪
The number of business firms in an industry
▪
Changes in the Prices of related goods and services
▪
The Costs of factor inputs of firms (labour, capital )
▪
Seasonality (Christmas, Easter, Valentine’s day )
▪
Commercial ads or Advertising
▪
Scientific Discoveries (medical, inventions, chemicals)
▪
Natural Disasters
▪
Government fiscal and monetary policies
▪
The rate of growth of the Population
▪
Sociological factors (age, sex, education, marriage)
FACTORS OF PRODUCTION
Economic resources are the goods or services available to individuals and businesses used to produce valuable consumer products. The classic economic resources include land, labour and capital.
Entrepreneurship is also considered an economic resource because individuals are responsible for creating businesses and moving economic resources in the business environment. These economic resources are also called the factors of production. The factors of production describe the function that each resource performs in the business environment.
LAND
Land is the economic resource encompassing natural resources found within a nation’s economy. This resource includes timber, land, fisheries, farms and other similar natural resources. Land is usually a limited resource for many economies. Although some natural resources, such as timber, food and animals, are renewable, the physical land is usually a fixed resource. Nations must carefully use their land resource by creating a mix of natural and industrial uses. Using land for industrial purposes allows nations to improve the production processes for turning natural resources into consumer goods.
LABOUR
Labour represents the human capital available to transform raw or national resources into consumer goods. Human capital includes all able-bodied individuals capable of working in the nation’s economy and providing various services to other individuals or businesses. This factor of production is a flexible resource as workers can be allocated to different areas of the economy for producing consumer goods or services.
Human capital can also be improved through training or educating workers to complete technical functions or business tasks when working with other economic resources.
CAPITAL
Capital has two economic definitions as a factor of production. Capital can represent the monetary resources companies use to purchase natural resources, land and other capital goods. Monetary resources flows through a nation’s economy as individuals buy and sell resources to individuals and businesses.
Capital also represents the major physical assets individuals and companies use when producing goods or services. These assets include buildings, production facilities, equipment, vehicles and other similar items.
Individuals may create their own capital production resources, purchase them from another individual or business or lease them for a specific amount of time from individuals or other businesses.
ENTREPRENEURSHIP
Entrepreneurship is considered a factor of production because economic resources can exist in an economy and not be transformed into consumer goods. Entrepreneurs usually have an idea for creating a valuable good or service and assume the risk involved with transforming economic resources into consumer products. Entrepreneurship is also considered a factor of production since someone must complete the managerial functions of gathering, allocating and distributing economic resources or consumer products to individuals and other businesses in the economy.

All four factors of production categories are important to the production of goods used in the wants-and-needs-satisfying process that keeps human beings alive from one day to the next and makes living just a little more enjoyable. Land provides the basic raw materials that become the goods. Labour does the hands-on work. Capital is the tools that make the job easier and entrepreneurship organises the entire process.
The production of any good or service inevitably requires four types of inputs. To see these inputs, consider a house being built by a new venture Construction Company.
1.
The first factor is a large number of workers. This includes the carpenters, electricians, concrete workers, plumbers, roofers, painters, and everyone else who hammers, saws, welds, digs, and performs the assorted tasks need in the construction process.
2.
The second factor is the tools used by workers. This includes hammers, electric saws, screw drivers, delivery trucks, scaffolding, paint brushes, shovels, and other equipment.
3.
The third factor is materials. This includes lumber, nails, screws, concrete, paint, roofing shingles, carpet, wallboard, bricks, and everything else that becomes the house.
4.
Fourth, is the organiser- this is the new venture entrepreneur, who makes the decision to build the house in the first place and then brings together the materials, workers, and tools needed to get the job done. Without someone to organize production, the other three factors do not produce. A key component of entrepreneurship is risk. This resource takes the risk of organizing production before anything is produced and with no guarantee that production will be successful.
THE ROLE OF MONEY IN THE ECONOMY
Modern economy is a money economy where all exchanges take place through money. Satisfaction of human wants is possible with a help of money. The intensity of want and the attainment of utility can be measured easily with the help of money. All economic activities relating to production, distribution, consumption etc can be motivated by money. Savings and investments can be made in the form of capital information. Thus, money is important in the dynamic society for everything.
Money is the fuel of the economy at three levels: The Reserve and the government, business firms and individuals. At each of these levels, money plays a different yet equally important role and each spend money with different goals in mind. These three levels also provide natural checks and balances against each other by virtue of their interconnected nature.
Value of Money in Circulation
How much money is in circulation has several important effects in economics. The South African Reserve Bank is responsible for either contracting or expanding the money supply via interest rates. The relationship between interest rates and inflation is directly proportionate. When interest rates are high, consumers are encouraged to save money instead of receiving loans and inflation is kept low. Conversely, when interest rates are low, consumers are encouraged to receive loans and spend money. This consumer spending keeps inflation high. How much money is in circulation can determine how quickly the economy grows, the level of employment and the ease or difficulty of receiving a loan.
Value of Money for Business Firms
Firms must have a healthy supply of money in order to stay in business. This money may come in the form of hard cash or investments. Many new businesses borrow money to cover the high start-up costs associated with entering an industry: Rent, inventory, equipment and labour are just a few costly factors of running a business. Most businesses fail due to cash flow problems. Examples of problems include firms not having enough money to cover bills or that do not invest extra cash wisely.
Value of Money for Individuals
How people allocate money in the economy is just as influential as how business firms and the government allocate it. Individuals can either save money or they can spend it, which stimulates economic growth and encourages hiring as a result of increased consumer demand. The spending habits of individuals are based on a number of factors, many of which are contingent on the government and firms. Spending factors include how confident they are in the economy and their income. Firms affect spending levels by the cost of goods and services, and the government affects spending by the level of taxation.

At all three levels, money must be in circulation to maintain a healthy economy. Money circulates in the government by receiving it through taxation and investment and spending it through programs like the military and education. With business firms, money must circulate by receiving it through the profit on the sale of goods and services and spending it on things like wages and research and development. Individuals receive money through
wages/salaries and interest on savings and spend it on goods and services.
This cycle falls apart when the government, business firms or individuals are unable to receive or spend money. For instance;
▪
Consumers go bankrupt without an income and can’t buy goods and services.
▪
Firms that receive no consumer demand go bankrupt.
▪
Governments that receive no taxes cannot spend on essential goods and services.
Thus, money is like the oil of the economy. Without a steady flow of it, the economy’s engine grinds to a halt.

REFLECTION
▪
Money helps in the smooth functioning of the economy in the following ways:
▪
Introduction of money eliminates all the inconveniences of barter system.
▪
It provides purchasing power, to buy goods and services and factors of production directly.
▪
Remuneration to all factors of production can be made in terms of money.
▪
By using money as a unit of accounts, debits and credits of transaction can be maintained in an economy.
▪
The performance of the country can be measured in terms of money.
▪
Money acts as a standard of deferred payment, so future transactions can be easily made.
▪
National Income can be distributed in terms of money.
▪
Trade and Commerce are facilitated by money.
▪
It facilitates specialisation and division of labour.
▪
Savings and investment can be made in the form of money
SUMMARY
SYNOPSIS
In this section you learnt to analyse the interaction of demand and supply in price determination.